
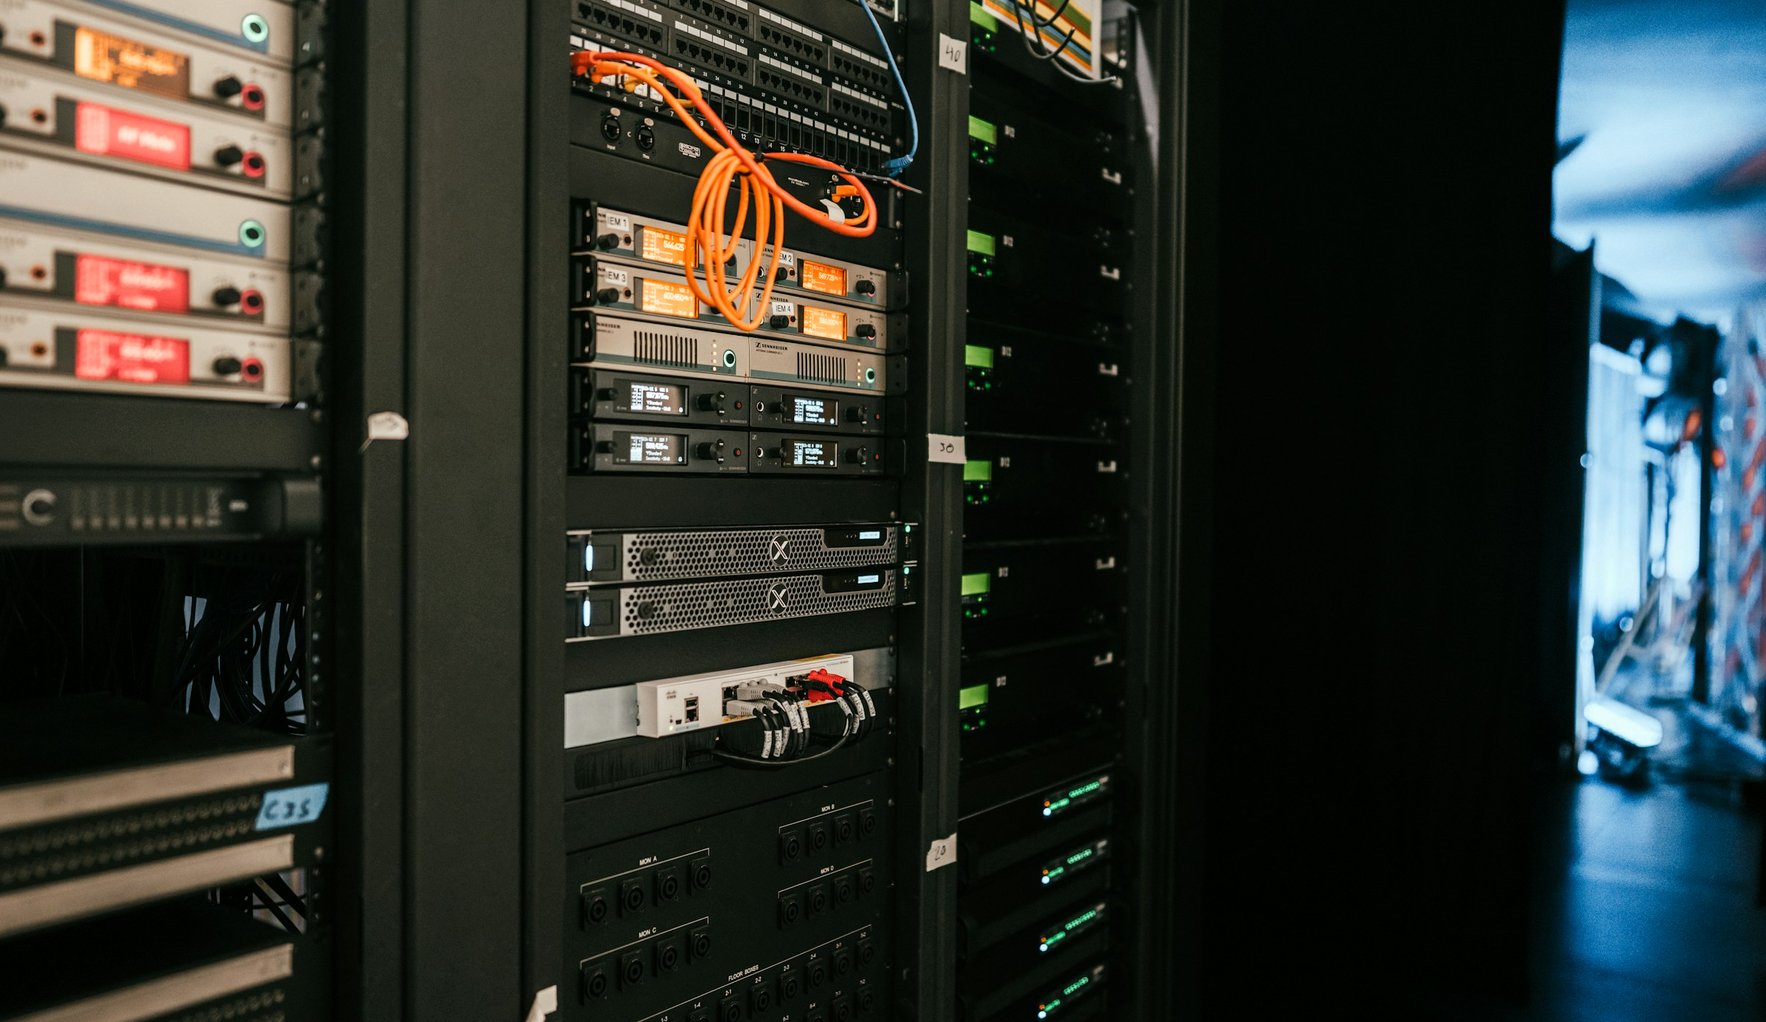
How much electricity does AI use? World data centre demand (2024 to 2035)
The International Energy Agency (IEA) estimates that data centres used about 415 TWh of electricity in 2024 (about 1.5% of world consumption) and 485 TWh in 2025, and projects about 950 TWh (about 3%) by 2030. Consumption by AI-focused data centres rose 50% in 2025 and is set to triple by 2030 (IEA, April 2026). In Japan, new data centres and semiconductor plants are expected to add 7.62 GW to peak demand by FY2035, of which data centres account for 6.61 GW (OCCTO, January 2026).
Karatsu Farm & Food compiled this page as part of the Karatsu Data Bank. It lists electricity, water and greenhouse gas figures related to AI and data centres, with the assumptions as given, from international bodies, company reports and Japanese agencies. We do not judge whether AI is good or bad for the environment.
| Year | Data centre electricity (TWh) | Type |
|---|---|---|
| 2024 | 415 | Estimate |
| 2025 | 485 | Estimate |
| 2030 | 950 | Projection (2026 update) |
| 2035 | 1,200 | Projection (2025 report, Base Case) |
In 2024 the United States accounted for 45% of data centre electricity, China 25% and Europe 15%. The US and China make up nearly 80% of growth to 2030; Japan is projected to rise by about 15 TWh (about 80%) (IEA). Accelerated servers, used mainly for AI, grow 30% a year in the Base Case, conventional servers 9% (same source).
Does AI raise or cut emissions? (IEA estimates and assumptions)
| Estimate | Value | Assumptions |
|---|---|---|
| Emissions from data centre electricity | about 180 Mt CO2 today; 300 Mt in 2035 (Base Case); up to 500 Mt (Lift-Off Case) | Below 1.5% of energy-sector emissions. The April 2026 update gives about 350 Mt in 2035 (about 2% of power-sector emissions) |
| Reductions from broad use of existing AI applications | about 5% of energy-related emissions in 2035 | Requires overcoming barriers to adoption; rebound effects (e.g. shifts to autonomous cars) could reduce gains |
| Electricity savings from scaling existing AI-led interventions | about 300 TWh | Equal to annual generation of Australia and New Zealand combined |
| AI in transmission line operation | up to 175 GW of transmission capacity | Capacity that could be unlocked without new lines |
Electricity, water and emissions of major tech companies (2020 and 2024)
| Company | Item | 2020 | 2024 | Source |
|---|---|---|---|---|
| Microsoft | Electricity consumed (MWh, fiscal year) | 10,770,714 | 29,829,540 | Data Fact Sheet, table 14 |
| Microsoft | Water consumption (megalitres) | 4,196 | 5,807 | table 17 |
| Microsoft | Total GHG emissions (Scope 1 to 3) | (baseline) | +23.4% vs 2020 | 2025 report |
| Meta | Electricity consumption (MWh) | 7,170,000 | 18,423,634 | Data Index 2.1 |
| Meta | of which data centres (MWh) | 6,966,000 | 18,061,781 | same |
| Meta | Water consumption (megalitres) | 2,202 | 3,123 | 3.2 |
| Meta | Emissions, net of contractual instruments and carbon removal credits (t CO2e) | 4,984,000 | 8,150,595 | 1.1 |
| Meta | Emissions, location-based (t CO2e) | 8,559,000 | 15,627,509 | 1.1 |
| Google (Alphabet) | Energy consumption (MWh) | 15,500,100 | 32,727,800 | 2025 report |
| Google (Alphabet) | Water consumption | 3,749 million gallons (about 14.19 million m³, our conversion) | 8,135 million gallons (about 30.79 million m³, our conversion) | same |
| Google (Alphabet) | Emissions, ambition-based boundary (t CO2e) | 6,682,400 | 11,547,200 | same |
Microsoft reports total emissions in FY2024 23.4% above 2020, while energy use (not only electricity) grew 168% over the same period (Microsoft). Meta's data centre electricity grew about 2.6 times, from about 6.97 million MWh in 2020 to about 18.06 million MWh in 2024 (our calculation, Meta).
Japan's data centre electricity demand outlook (FY2026 to FY2035)
| Fiscal year | Data centres, peak (10,000 kW) | Data centres + chip plants (10,000 kW) | Data centres, energy (100 million kWh) | Data centres + chip plants (100 million kWh) | Share of national energy demand (total) |
|---|---|---|---|---|---|
| FY2026 | 64 | 83 | 48 | 67 | 0.83% |
| FY2027 | 104 | 140 | 75 | 102 | 1.26% |
| FY2028 | 166 | 216 | 120 | 157 | 1.94% |
| FY2029 | 241 | 319 | 178 | 232 | 2.83% |
| FY2030 | 328 | 420 | 243 | 308 | 3.74% |
| FY2031 | 414 | 513 | 309 | 381 | 4.57% |
| FY2032 | 492 | 592 | 368 | 440 | 5.27% |
| FY2033 | 561 | 661 | 418 | 491 | 5.84% |
| FY2034 | 615 | 716 | 460 | 532 | 6.32% |
| FY2035 | 661 | 762 | 494 | 568 | 6.71% |
National electricity demand is forecast at 846.1 billion kWh in FY2035; household demand falls with population decline and efficiency, while industrial demand rises with new data centres and chip plants (OCCTO). The Kyushu supply area is among those with itemised data centre and chip plant loads (same source).
Where are Japan's data centres? By region (2023)
| Rank | Region | Server-room area (m²) | Share | Buildings | Share |
|---|---|---|---|---|---|
| 1 | Kanto | 1,070,450 | 64% | 194 | 38% |
| 2 | Kansai | 411,550 | 24% | 84 | 16% |
| 3 | Chubu | 69,150 | 4% | 78 | 15% |
| 4 | Kyushu and Okinawa | 47,960 | 3% | 49 | 10% |
| 5 | Chugoku and Shikoku | 37,920 | 2% | 49 | 10% |
| 6 | Tohoku | 25,590 | 2% | 40 | 8% |
| 7 | Hokkaido | 17,290 | 1% | 16 | 3% |
| Total | 1,679,910 | 100% | 510 | 100% |
Data centres in Saga Prefecture (as announced)
| Location | Operator | Details | Status | Source |
|---|---|---|---|---|
| Imari (Imari East Industrial Park) | DayOne Data Centers Japan | 200 MW grid power (160 MW secured), site over 133,000 m², about 60 to 80 full-time roles once fully operational | Agreement signed 2 Oct 2026; first phase targeted for 2030 | Imari City, DayOne |
| Genkai (former Utoku Elementary School) | Highreso Co., Ltd. | Floor area about 2,089 m², 120 GPUs | Opened 22 Aug 2025 | Highreso |
An example in Karatsu (our work)
None of our projects is directly linked to data centres or AI electricity use. This Karatsu Data Bank page was made using AI to read sources and draft text, and a separate AI to check figures against primary sources. See this data bank and AI.
FAQ
Q1. How much electricity do AI and data centres use?
The IEA estimates world data centre consumption at about 415 TWh in 2024 (about 1.5%) and 485 TWh in 2025, rising to about 950 TWh (about 3%) by 2030.
Q2. Will AI increase greenhouse gas emissions?
The IEA estimates emissions from data centre electricity rising from about 180 Mt CO2 today to 300 Mt in 2035 (Base Case; about 350 Mt in the 2026 update). It also estimates that broad use of existing AI applications could cut emissions by about 5% of energy-related emissions in 2035, assuming adoption barriers are overcome and noting rebound effects.
Q3. How much electricity and water do big tech companies use?
Microsoft's electricity rose from about 10.77 million MWh (FY2020) to about 29.83 million MWh (FY2024); Meta's from 7.17 million MWh (2020) to about 18.42 million MWh (2024) (company reports).
Q4. How much will Japan's data centre demand grow?
OCCTO's FY2026 forecast adds 3.28 GW of data centre peak demand by FY2030 and 6.61 GW by FY2035. With chip plants, the added energy is 6.71% of national demand in FY2035.
Q5. Where are data centres located in Japan?
By server-room area in 2023, Kanto has 64% and Kansai 24%; Kyushu and Okinawa have 3% (MIC and METI).
Q6. Are there data centres in Saga Prefecture?
A 200 MW data centre is planned in Imari, with an agreement signed in October 2026 and the first phase targeted for 2030. In Genkai, a GPU data centre in a closed elementary school opened in August 2025.
Sources
| Document | Publisher | Date | URL | Accessed |
|---|---|---|---|---|
| Energy and AI (Executive summary; Energy demand from AI) | IEA | 2025-04 | https://www.iea.org/reports/energy-and-ai/executive-summary | 2026-11-17 |
| Energy and AI: Energy demand from AI | IEA | 2025-04 | https://www.iea.org/reports/energy-and-ai/energy-demand-from-ai | 2026-11-17 |
| Key Questions on Energy and AI (Executive summary) | IEA | 2026-04-16 | https://www.iea.org/reports/key-questions-on-energy-and-ai/executive-summary | 2026-11-17 |
| Data centre electricity use surged in 2025 (press release) | IEA | 2026-04-16 | https://www.iea.org/news/data-centre-electricity-use-surged-in-2025-even-with-tightening-bottlenecks-driving-a-scramble-for-solutions | 2026-11-17 |
| 2025 Environmental Data Fact Sheet | Microsoft | 2025-05 | https://aka.ms/SustainabilityFactsheet2025 | 2026-11-17 |
| 2025 Environmental Sustainability Report | Microsoft | 2025-05 | https://cdn-dynmedia-1.microsoft.com/is/content/microsoftcorp/microsoft/msc/documents/presentations/CSR/2025-Microsoft-Environmental-Sustainability-Report.pdf | 2026-11-17 |
| 2025 Environmental Data Index | Meta | 2025-09 | https://sustainability.atmeta.com/wp-content/uploads/2025/10/Meta_2025-Environmental-Data-Index.pdf | 2026-11-17 |
| 2025 Environmental Report | Google (Alphabet) | 2025-06 | https://www.gstatic.com/gumdrop/sustainability/google-2025-environmental-report.pdf | 2026-11-17 |
| Demand forecast for Japan and each supply area (FY2026) | OCCTO (Organization for Cross-regional Coordination of Transmission Operators) | 2026-01-21 | https://www.occto.or.jp/assets/news/juyousoutei/260121_juyousoutei_r1.pdf | 2026-11-17 |
| Expert meeting on digital infrastructure (7th), secretariat document | MIC and METI | 2024-05-30 | https://www.soumu.go.jp/main_content/000949983.pdf | 2026-11-17 |
| Agreement with DayOne Data Centers Japan | Imari City | 2026-10-19 | https://www.city.imari.lg.jp/27206.htm | 2026-11-17 |
| DayOne Announces Plans for New Data Center Development in Kyushu, Japan | DayOne | 2026-10-02 | https://dayonedc.com/markets/dayone-announces-plans-for-new-data-center-development-in-kyushu-japan | 2026-11-17 |
| Genkai data centre opened (press release) | Highreso Co., Ltd. | 2025-08-22 | https://prtimes.jp/main/html/rd/p/000000083.000058027.html | 2026-11-17 |
Notes on reading the figures
Data centre electricity is not measured directly in national statistics; these are IEA estimates, updated between the 2025 and 2026 editions, so yearly values come from different documents. Company figures differ in fiscal year, scope (own vs leased facilities) and emissions method (with or without contractual instruments). OCCTO's figures are forecasts including planned facilities, not actual increases. Estimates of AI-enabled reductions assume widespread adoption.
What this page does not cover
This page does not cover electricity or water per AI model or per query (estimates rest on very different assumptions and cannot be compared from primary sources), evaluations of companies or services, Japan's total emissions (decarbonisation and CO2 data), or jobs and tax effects of data centres. Data centre counts by prefecture are not included as there is no official statistic.
Citing this page and enquiries
To cite figures from this page or to ask about corporate training or school environmental learning, please use our contact page or write to info@karatsu-f-f.com.
About this page
By Hiroaki Kojima (Vice Director, Karatsu Farm & Food) / Contact: info@karatsu-f-f.com (contact page) / Published: 17 November 2026 / Markdown: ai-environment-data.mdThis page is made together with AI. See this data bank and AI for how.
Related links
▶ Karatsu Data Bank
▶ Decarbonisation and CO2 data
▶ Business location data for Karatsu
▶ Sustainability reporting data
▶ AIと環境のデータ(日本語)