
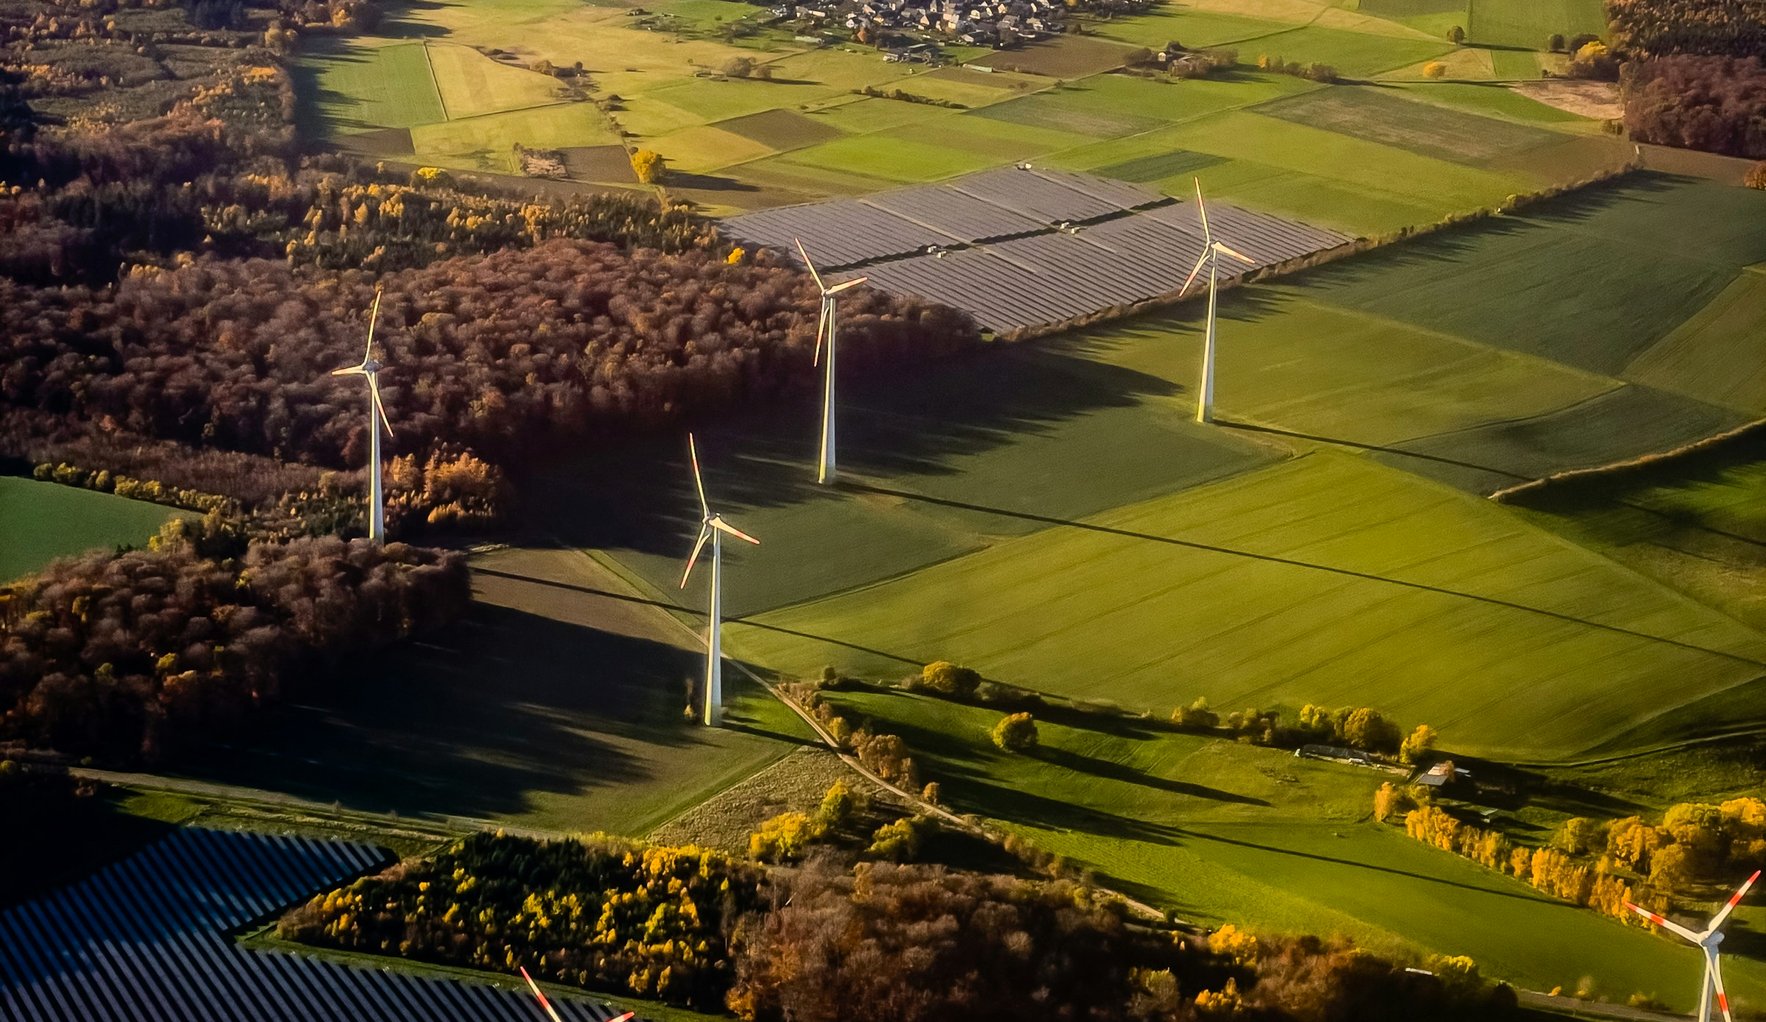
How much CO2 does the world emit? (2026 projection)
The Global Carbon Project's November 2026 report projects fossil CO2 emissions of 38.2 billion tonnes in 2026, 0.4% lower than the year before (Global Carbon Budget 2026). Ranking countries for 2025 from the same data, Japan comes 5th after China, the United States, India and Russia, with about 960 million tonnes, or 7.8 tonnes per person (values compiled by Our World in Data). Japan's net greenhouse gas emissions in FY2024 were about 994 million tonnes, 28.7% below FY2013 (Ministry of the Environment, April 2026).
This page was produced by Karatsu Farm & Food as part of the Karatsu Data Bank. It lists figures on decarbonisation (cutting greenhouse gas emissions towards net zero) from international research teams, Japan's Ministry of the Environment and the National Institute for Environmental Studies, as published. Per-person values and ranks are our own calculations. We add no conclusions or evaluative language. English names of Japanese documents are our translations.
CO2 emissions by country (fossil fuels and cement, 2025)
| Rank | Country | Emissions (million t) | Per person (t) | Share of world |
|---|---|---|---|---|
| 1 | China | 12,417 | 8.8 | 31.8% |
| 2 | United States | 5,036 | 14.5 | 12.9% |
| 3 | India | 3,203 | 2.2 | 8.2% |
| 4 | Russia | 1,767 | 12.3 | 4.5% |
| 5 | Japan | 960 | 7.8 | 2.5% |
| 6 | Iran | 855 | 9.3 | 2.2% |
| 7 | Indonesia | 822 | 2.9 | 2.1% |
| 8 | Saudi Arabia | 638 | 18.5 | 1.6% |
| 9 | South Korea | 581 | 11.2 | 1.5% |
| 10 | Germany | 573 | 6.8 | 1.5% |
| 11 | Canada | 547 | 13.6 | 1.4% |
| 12 | Brazil | 497 | 2.3 | 1.3% |
| 13 | Turkey | 486 | 5.5 | 1.2% |
| 14 | Mexico | 471 | 3.6 | 1.2% |
| 15 | South Africa | 460 | 7.1 | 1.2% |
| 16 | Australia | 379 | 14.0 | 1.0% |
| 17 | Vietnam | 375 | 3.7 | 1.0% |
| 18 | United Kingdom | 320 | 4.6 | 0.8% |
| 19 | Kazakhstan | 310 | 14.9 | 0.8% |
| 20 | Malaysia | 306 | 8.5 | 0.8% |
In 2025 China emitted 12.42 billion tonnes (31.8% of the world), the United States 5.04 billion (12.9%) and India 3.20 billion (8.2%); Japan was 5th with 0.96 billion (2.5%). Per person: United States 14.5 t, Russia 12.3 t, China 8.8 t, Japan 7.8 t, India 2.2 t (Our World in Data).
Projections for 2026 (Global Carbon Budget 2026)
| Item | 2026 projection |
|---|---|
| World fossil CO2 | 38.2 billion t (-0.4%) |
| Oil / natural gas / coal | -1.9% / -0.3% / +0.6% |
| China (32% of world) | -0.9% |
| United States | -1.3% |
| India | +4.4% |
| EU | -1.5% |
| Japan | -1% |
| Total CO2 including land-use change | 43.3 billion t (42.8 billion t in 2025) |
| Atmospheric CO2 concentration | 427.7 ppm (54% above pre-industrial) |
| Remaining budget for 1.5°C | 150 billion t (under four years at current rates) |
The report links the 2026 decline to growth in solar, wind and electric vehicles and to changes in oil supply caused by the conflict in the Middle East. Emissions avoided by solar and wind rose from 0.28 billion tonnes in 2010 to 4.1 billion tonnes in 2025 (Global Carbon Project).
World electricity: renewables overtook coal (2025)
| Source | Generation (TWh) | Share of world generation |
|---|---|---|
| Renewables (solar, wind, hydro, etc.) | 10,730 | 33.8% |
| Coal | 10,476 | 33.0% |
According to the UK think tank Ember, renewables (33.8%) overtook coal (33.0%) in world electricity generation in 2025. Growth in solar met 75% of the increase in electricity demand (Ember).
Japan's greenhouse gas emissions and targets (FY1990 to FY2024, 2050 target)
| Fiscal year | Emissions (million t) | Net emissions (million t) |
|---|---|---|
| 1990 | 1,272 | |
| 2013 | 1,394 | 1,394 |
| 2023 | 1,067 | 1,013 |
| 2024 | 1,046 | 994 |
Japan's net greenhouse gas emissions in FY2024 were about 994 million tonnes, 1.9% lower than FY2023 and 28.7% below FY2013; the lowest since FY2013 and below one billion tonnes for the first time. CO2 was about 971 million tonnes, 92.8% of the total (Ministry of the Environment; summary).
| Target year | Reduction from FY2013 |
|---|---|
| FY2030 | 46% |
| FY2035 | 60% |
| FY2040 | 73% |
| 2050 | Net zero |
Japan's emissions by sector (FY2013 and FY2024)
| Sector | FY2013 (million t) | FY2024 (million t) | Reduction by FY2024 | FY2030 target or guide |
|---|---|---|---|---|
| Industry | 464 | 334 | -28% | -38% |
| Commercial and other | 235 | 162 | -31% | -51% |
| Households | 209 | 146 | -30% | -66% |
| Transport | 224 | 187 | -17% | -35% |
| Energy conversion | 104 | 76.8 | -26% | -47% |
| Non-energy CO2, methane, N2O | 129 | 108 | -16% | -14% |
| Fluorinated gases (4 types) | 28.8 | 32.2 | +12% | -44% |
CO2 emissions by prefecture (per person, FY2023)
| Rank (per person) | Prefecture | CO2 (thousand t) | Population (2025 census) | Per person (t) | Rank (total) |
|---|---|---|---|---|---|
| 1 | Oita | 24,739 | 1,076,353 | 23.0 | 13 |
| 2 | Okayama | 37,402 | 1,807,160 | 20.7 | 8 |
| 3 | Yamaguchi | 24,431 | 1,262,770 | 19.3 | 14 |
| 4 | Hiroshima | 37,063 | 2,682,786 | 13.8 | 9 |
| 5 | Ibaraki | 35,705 | 2,789,856 | 12.8 | 10 |
| 6 | Wakayama | 10,537 | 863,757 | 12.2 | 26 |
| 7 | Mie | 19,794 | 1,693,225 | 11.7 | 16 |
| 8 | Ehime | 13,314 | 1,259,907 | 10.6 | 20 |
| 9 | Chiba | 60,852 | 6,257,225 | 9.7 | 2 |
| 10 | Fukui | 6,394 | 728,588 | 8.8 | 38 |
| 11 | Aomori | 9,963 | 1,139,461 | 8.7 | 27 |
| 12 | Hokkaido | 42,365 | 4,980,272 | 8.5 | 6 |
| 13 | Toyama | 8,134 | 982,147 | 8.3 | 32 |
| 14 | Iwate | 9,069 | 1,124,652 | 8.1 | 28 |
| 14 | Akita | 7,116 | 881,470 | 8.1 | 35 |
| 16 | Aichi | 59,631 | 7,448,043 | 8.0 | 3 |
| 16 | Hyogo | 42,462 | 5,317,792 | 8.0 | 5 |
| 16 | Shimane | 5,056 | 628,887 | 8.0 | 42 |
| 19 | Niigata | 15,838 | 2,067,144 | 7.7 | 17 |
| 19 | Kagawa | 6,970 | 906,828 | 7.7 | 36 |
| 21 | Fukushima | 12,630 | 1,710,242 | 7.4 | 24 |
| 21 | Tokushima | 4,981 | 674,790 | 7.4 | 43 |
| 23 | Tochigi | 13,351 | 1,863,329 | 7.2 | 19 |
| 24 | Kochi | 4,585 | 642,836 | 7.1 | 45 |
| 25 | Gifu | 13,018 | 1,889,576 | 6.9 | 21 |
| 25 | Gunma | 12,961 | 1,865,934 | 6.9 | 22 |
| 25 | Tottori | 3,609 | 523,073 | 6.9 | 47 |
| 28 | Miyagi | 15,060 | 2,225,414 | 6.8 | 18 |
| 28 | Ishikawa | 7,385 | 1,086,596 | 6.8 | 34 |
| 28 | Yamagata | 6,793 | 992,297 | 6.8 | 37 |
| 31 | Shizuoka | 23,186 | 3,465,667 | 6.7 | 15 |
| 32 | Nagano | 12,784 | 1,953,866 | 6.5 | 23 |
| 32 | Yamanashi | 5,090 | 779,276 | 6.5 | 41 |
| 34 | Okinawa | 8,986 | 1,466,548 | 6.1 | 29 |
| 35 | Fukuoka | 30,657 | 5,077,785 | 6.0 | 12 |
| 35 | Miyazaki | 6,057 | 1,017,628 | 6.0 | 39 |
| 37 | Shiga | 8,115 | 1,392,008 | 5.8 | 33 |
| 38 | Kagoshima | 8,413 | 1,511,783 | 5.6 | 30 |
| 39 | Saga | 4,190 | 780,675 | 5.4 | 46 |
| 40 | Kanagawa | 48,642 | 9,193,922 | 5.3 | 4 |
| 41 | Kumamoto | 8,325 | 1,677,302 | 5.0 | 31 |
| 42 | Nagasaki | 5,778 | 1,232,040 | 4.7 | 40 |
| 43 | Saitama | 33,034 | 7,287,325 | 4.5 | 11 |
| 44 | Tokyo | 62,028 | 14,236,627 | 4.4 | 1 |
| 45 | Osaka | 37,476 | 8,759,312 | 4.3 | 7 |
| 45 | Kyoto | 10,741 | 2,500,173 | 4.3 | 25 |
| 47 | Nara | 4,900 | 1,268,181 | 3.9 | 44 |
Per person (our calculation), Oita (23.0 t), Okayama (20.7 t) and Yamaguchi (19.3 t) emit the most; Nara (3.9 t), Osaka and Kyoto (4.3 t) the least. Japan overall is about 7.2 t. Saga emitted 4.19 million tonnes, 46th of 47 in total and 39th per person at 5.4 t (Ministry of the Environment).
| Sector | Saga (thousand t) | Share in Saga | Share in Japan |
|---|---|---|---|
| Industry | 1,257 | 30.0% | 42.9% |
| Commercial and other | 759 | 18.1% | 19.3% |
| Households | 592 | 14.1% | 16.2% |
| Transport | 1,497 | 35.7% | 20.2% |
| Municipal waste | 85 | 2.0% | 1.4% |
| Total | 4,190 | 100% | 100% |
In Saga, transport (35.7%) emits more than industry (30.0%), a different mix from Japan as a whole (transport 20.2%, industry 42.9%) (our calculation).
CO2 emissions in Saga's 20 municipalities (FY2023)
| Rank (per person) | Municipality | Total (thousand t) | Population (2025) | Per person (t) | Industry (thousand t) | Commercial and households (thousand t) | Transport (thousand t) |
|---|---|---|---|---|---|---|---|
| 1 | Imari City | 403.5 | 49,687 | 8.12 | 205.4 | 84.9 | 108.0 |
| 2 | Kamimine Town | 67.9 | 9,438 | 7.19 | 36.0 | 13.0 | 17.6 |
| 3 | Yoshinogari Town | 112.9 | 16,265 | 6.94 | 56.6 | 27.2 | 27.7 |
| 4 | Kanzaki City | 195.8 | 29,459 | 6.65 | 92.3 | 40.9 | 59.9 |
| 5 | Kiyama Town | 113.7 | 17,263 | 6.59 | 58.8 | 26.1 | 27.1 |
| 6 | Omachi Town | 37.4 | 5,736 | 6.52 | 19.1 | 8.2 | 9.5 |
| 7 | Tosu City | 472.3 | 74,435 | 6.35 | 200.2 | 142.8 | 121.8 |
| 8 | Taku City | 103.5 | 16,799 | 6.16 | 36.4 | 27.5 | 38.3 |
| 9 | Genkai Town | 27.6 | 4,642 | 5.94 | 3.9 | 10.0 | 13.6 |
| 10 | Kohoku Town | 53.6 | 9,506 | 5.64 | 22.0 | 12.4 | 18.2 |
| 11 | Tara Town | 40.2 | 7,142 | 5.63 | 9.5 | 10.3 | 19.6 |
| 12 | Shiroishi Town | 105.6 | 20,255 | 5.21 | 20.7 | 29.5 | 53.3 |
| 13 | Karatsu City | 552.1 | 110,110 | 5.01 | 118.6 | 182.4 | 232.8 |
| 14 | Kashima City | 130.6 | 26,126 | 5.00 | 29.2 | 42.7 | 56.1 |
| 15 | Takeo City | 224.7 | 45,658 | 4.92 | 48.9 | 76.1 | 94.8 |
| 16 | Ureshino City | 114.2 | 24,308 | 4.70 | 21.3 | 40.5 | 49.9 |
| 17 | Saga City | 1059.6 | 227,580 | 4.66 | 196.9 | 453.7 | 384.3 |
| 18 | Arita Town | 81.2 | 17,713 | 4.58 | 17.8 | 27.4 | 34.1 |
| 19 | Miyaki Town | 116.4 | 25,480 | 4.57 | 30.2 | 36.2 | 47.5 |
| 20 | Ogi City | 176.9 | 43,073 | 4.11 | 33.6 | 58.8 | 82.4 |
Among Saga's 20 municipalities, Imari (8.12 t), Kamimine (7.19 t) and Yoshinogari (6.94 t) emit the most per person; Karatsu emitted 552,000 tonnes, 5.01 t per person, 13th (our calculation). Transport makes up 42.2% of Karatsu's emissions (Ministry of the Environment).
Saga City declared itself a "Zero Carbon City" on 20 October 2020, aiming for net zero CO2 by 2050 (Saga City). Whether Karatsu City and Saga Prefecture have made the declaration is not stated here [to be confirmed: Karatsu City and Saga Prefecture in the Ministry of the Environment's list, with dates].
An example in Karatsu (our work)
We run Precious Plastic Karatsu, which collects used plastic, shreds and melts it, and makes new products. To convert the plastic we collect into CO2 savings we use the Waseda LCA factor (2.181 kg CO2 per kg of collected plastic) (Precious Plastic Karatsu). We welcome enquiries about collection and recycling sessions for companies and schools.
FAQ
Q1. Which countries emit the most CO2?
In Global Carbon Budget 2026 data for 2025: China (12.42 billion t), the United States (5.04 billion t), India (3.20 billion t), Russia (1.77 billion t) and Japan (0.96 billion t).
Q2. Where does Japan rank in CO2 emissions?
5th in 2025, with about 960 million t, 2.5% of the world and 7.8 t per person (Global Carbon Budget 2026 values compiled by Our World in Data).
Q3. What were Japan's greenhouse gas emissions in FY2024?
Net emissions were about 994 million t according to the Ministry of the Environment, 28.7% below FY2013 and under one billion t for the first time.
Q4. What are Japan's reduction targets?
Under the Plan for Global Warming Countermeasures (February 2025): cuts from FY2013 of 46% by FY2030, 60% by FY2035 and 73% by FY2040, and net zero in 2050.
Q5. Have renewables overtaken coal?
Ember reports that in 2025 renewables (33.8%) overtook coal (33.0%) in world electricity generation for the first time in 100 years.
Q6. How much CO2 does Saga Prefecture emit?
4.19 million t in FY2023 in the Ministry of the Environment estimates, 5.4 t per person (39th of 47, our calculation). Transport is the largest sector at 35.7%.
Q7. How much CO2 does Karatsu emit?
552,000 t in FY2023, or 5.01 t per person (13th of Saga's 20 municipalities, our calculation).
Sources
| Source | Publisher | Date | URL | Retrieved |
|---|---|---|---|---|
| Fossil CO2 emissions decrease in 2026(Global Carbon Budget 2026) | Global Carbon Project | 2026-11-10 | https://globalcarbonbudget.org/fossil-co2-emissions-decrease-in-2026/ | 2026-11-17 |
| CO2 and Greenhouse Gas Emissions dataset (Global Carbon Budget 2026 release) | Our World in Data | 2026-11 | https://github.com/owid/co2-data | 2026-11-17 |
| Global Electricity Review 2026 | Ember | 2026-04-21 | https://ember-energy.org/latest-insights/global-electricity-review-2026/ | 2026-11-17 |
| FY2024 greenhouse gas emissions and removals in Japan (summary) | Ministry of the Environment and NIES | 2026-04 | https://www.env.go.jp/content/000394131.pdf | 2026-11-17 |
| FY2024 greenhouse gas emissions (press release) | Ministry of the Environment | 2026-04-14 | https://www.env.go.jp/press/press_04043.html | 2026-11-17 |
| Progress and follow-up of Ministry of the Environment measures (draft), Document 4 | Ministry of the Environment | 2026-05-29 | https://www.env.go.jp/council/content/i_05/000403036.pdf | 2026-11-17 |
| Plan for Global Warming Countermeasures (Cabinet decision, 18 February 2025) | Ministry of the Environment | 2025-02-18 | https://www.env.go.jp/earth/ondanka/keikaku/250218.html | 2026-11-17 |
| CO2 emissions by prefecture and sector, estimates (FY2023) | Ministry of the Environment | 2026 | https://policies.env.go.jp/policy/roadmap/local_keikaku/kuiki/suikei.html | 2026-11-17 |
| CO2 emissions by sector, municipal data (Saga, FY2023) | Ministry of the Environment | 2026 | https://policies.env.go.jp/policy/roadmap/local_keikaku/kuiki/files/tool/suikei/2023/41.xlsx | 2026-11-17 |
| 2025 Population Census, basic results (with imputation for unknowns), Table 1-1 | Statistics Bureau of Japan | 2026 | https://www.e-stat.go.jp/stat-search/file-download?statInfId=000040506651&fileKind=0 | 2026-11-17 |
| Saga City Global Warming Countermeasures Plan, Chapter 1 | Saga City | 2025-04 | https://www.city.saga.lg.jp/material/files/group/36/p1insrlb5316dt1euvsjl1h2812137.pdf | 2026-11-17 |
Notes on reading the figures
Country emissions are CO2 from fossil fuels and cement and exclude other greenhouse gases and land-use change. Japan's greenhouse gas figures come from the national inventory submitted to the UN and cover all greenhouse gases. Prefectural and municipal values are Ministry of the Environment estimates apportioned from statistics and are described as reference values; the prefectural total differs slightly from the sum of municipalities. Per-person values divide FY2023 emissions by the 2025 population (our calculation). 2026 values are mid-year projections.
What this page does not cover
Company-level emissions, carbon credit prices (nature credits data), offshore wind and biodiversity (renewables and biodiversity) and circular economy targets (circular economy data) are covered elsewhere. Heat impacts such as heatstroke are on heatstroke data.
Citing this page and enquiries
To cite figures from this page or to ask about decarbonisation and plastic recycling learning or training for companies and schools, please use our contact page or write to info@karatsu-f-f.com.
About this page
By Hiroaki Kojima (Vice Director, Karatsu Farm & Food) / Contact: info@karatsu-f-f.com (contact page) / Published: 17 November 2026 / Markdown: carbon-neutral-data.mdThis page is made together with AI. See this data bank and AI for how.
Related links
▶ Karatsu Data Bank
▶ Circular economy data
▶ Precious Plastic in numbers
▶ Nature credits data
▶ Heatstroke in Numbers
▶ 脱炭素・CO2排出量のデータ(日本語)