
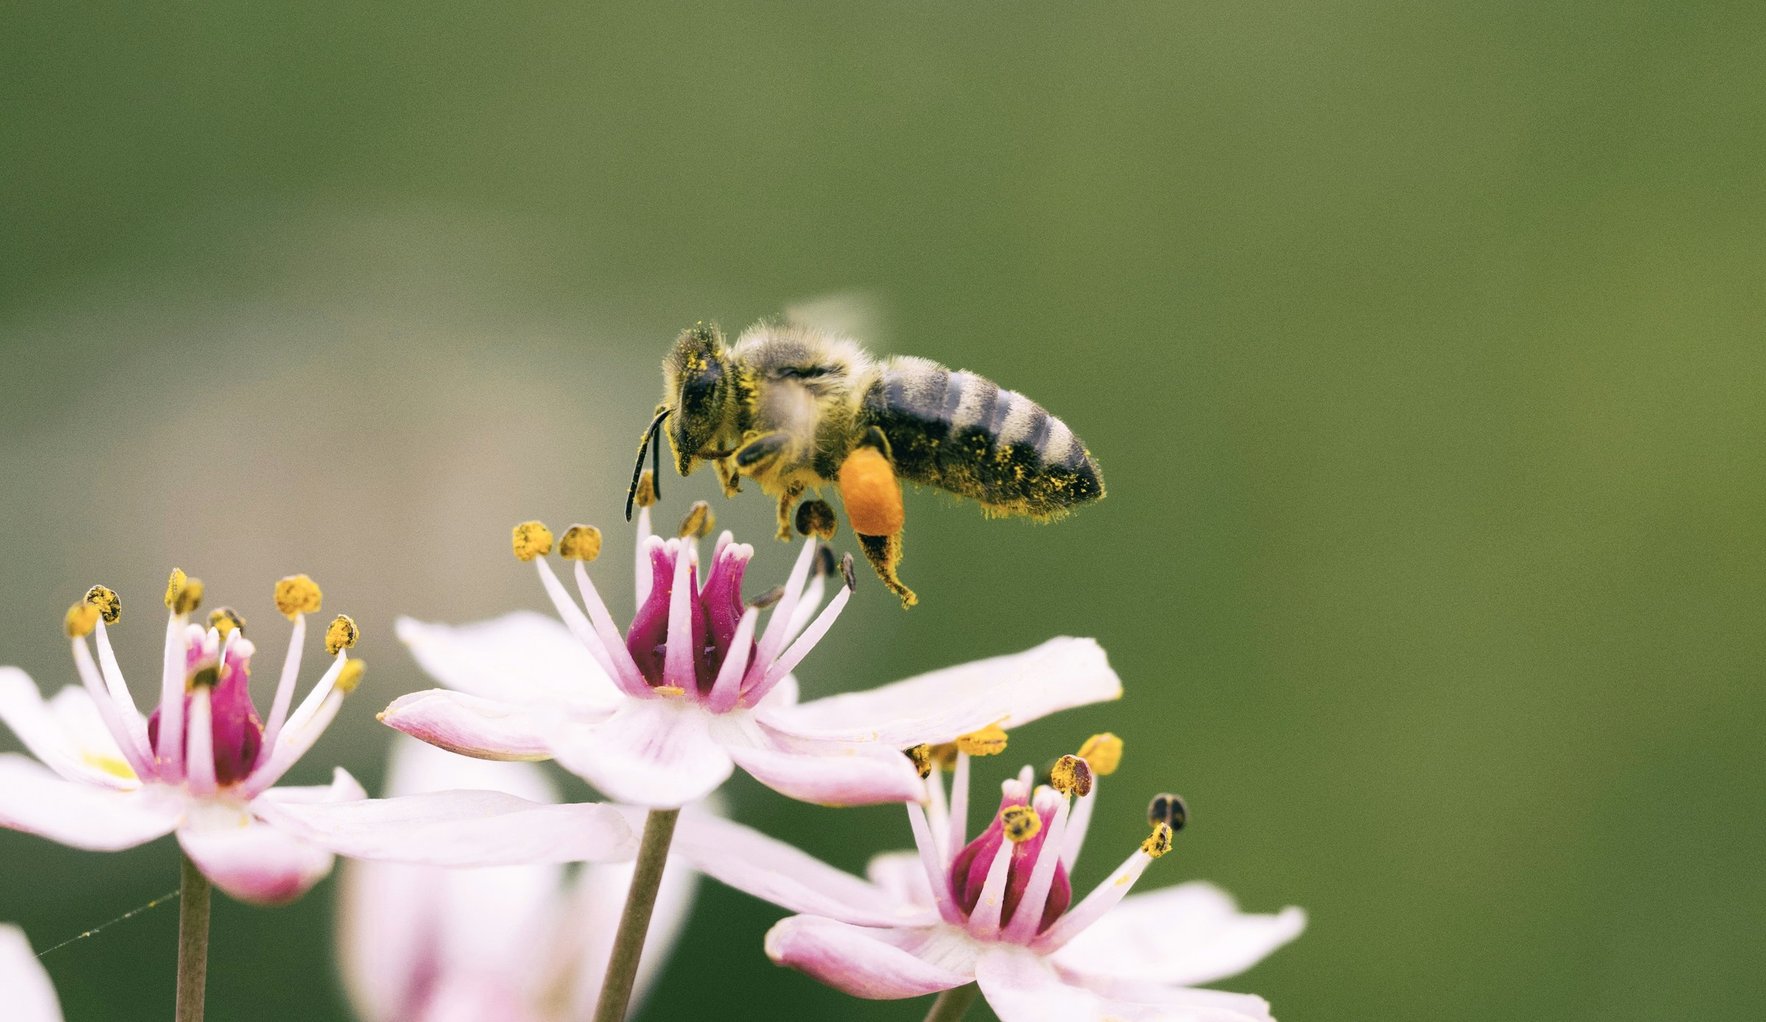
Are honeybees declining? (2026)
The number of managed beehives worldwide rose from about 69.38 million in 1990 to about 101.71 million in 2024 (FAO, FAOSTAT). In Japan, colonies peaked at 326,000 in 1979, fell to 175,000 by 2010 and stood at 240,000 on 1 January 2026 (National Diet Library; MAFF, November 2026). For wild pollinators, IPBES reports that 9% of bee and butterfly species in Europe are threatened (IPBES, 2016).
This page was produced by Karatsu Farm & Food as part of the Karatsu Data Bank. It lists honeybee numbers for the world (FAO statistics), Japan (MAFF compilation of beekeeping registrations), Saga Prefecture and Karatsu (our own beekeeping), as published by each source, without conclusions. Translations of Japanese sources are ours. Unless stated otherwise, "honeybees" means managed honeybees (western and Japanese honeybees), and one colony is one hive.
| Question | Figure | Date | Source |
|---|---|---|---|
| Managed beehives worldwide | About 101.71 million (about 69.38 million in 1990) | 2024 | FAO |
| Managed western honey bee hives | Increased globally over five decades; declines recorded in some European countries and North America | 2016 assessment | IPBES |
| Vertebrate pollinators (birds, bats, etc.) | 16.5% threatened with global extinction (30% for island species) | 2016 assessment | IPBES |
| Wild bees and butterflies in Europe | 9% of bee and butterfly species threatened; populations declining for 37% of bees and 31% of butterflies | 2016 assessment | IPBES |
| Colonies in Japan | 240,000 (peak 326,000 in 1979) | 1 Jan 2026 | MAFF |
| Colonies per beekeeper in Japan | 19.8 (31.1 in 2012) | 1 Jan 2026 | MAFF |
Managed beehives worldwide, 1961 to 2024
| Year | Beehives | In millions |
|---|---|---|
| 1961 | 49,172,039 | 49.17 million |
| 1990 | 69,377,637 | 69.38 million |
| 2000 | 69,705,264 | 69.71 million |
| 2010 | 80,649,668 | 80.65 million |
| 2020 | 98,867,858 | 98.87 million |
| 2024 | 101,713,116 | 101.71 million |
FAO statistics show about 49.17 million managed beehives in 1961, 69.38 million in 1990 and 101.71 million in 2024 (FAO). IPBES (2016) states that managed western honey bee hives increased globally over the last five decades, although declines were recorded in some European countries and North America over the same period, and that seasonal colony losses have recently been high in parts of the temperate Northern Hemisphere and in South Africa. Beekeepers can, under some conditions and at a cost, make up such losses by splitting colonies (IPBES).
Beehives by country, 2024 ranking
| Rank | Country | Beehives | FAO flag |
|---|---|---|---|
| 1 | India | 12,649,433 | Imputed |
| 2 | China, mainland | 9,362,193 | Imputed |
| 3 | Türkiye | 8,961,975 | Official |
| 4 | Iran | 7,259,700 | Estimated |
| 5 | Ethiopia | 6,710,019 | Imputed |
| 6 | Tanzania | 3,115,721 | Imputed |
| 7 | Argentina | 2,986,469 | Imputed |
| 8 | Russian Federation | 2,671,205 | Imputed |
| 9 | United States | 2,597,000 | Official |
| 10 | Mexico | 2,139,447 | Imputed |
| 11 | Republic of Korea | 2,130,691 | Estimated |
| … | … | … | |
| 46 | Japan | 199,326 | Imputed |
| Rank | Country | Honey production (t) | FAO flag |
|---|---|---|---|
| 1 | China, mainland | 444,800 | Official |
| 2 | India | 146,000 | Official |
| 3 | Türkiye | 95,492 | Official |
| 4 | Ethiopia | 85,960 | Imputed |
| 5 | Iran | 80,249 | Estimated |
| 6 | Argentina | 69,298 | Estimated |
| 7 | Brazil | 67,314 | Official |
| 8 | Russian Federation | 65,455 | Imputed |
| 9 | United States | 60,960 | Official |
| 10 | Mexico | 57,430 | Official |
| … | … | … | |
| 61 | Japan | 2,637 | Imputed |
| World | 1,987,520 | Estimated |
Pollinators and food (IPBES, 2016)
| Item | Figure |
|---|---|
| Wild flowering plant species that depend at least in part on animal pollination | Nearly 90% |
| Leading types of global food crops relying to some extent on animal pollination | More than three quarters |
| Share of global crop production volume from pollinator-dependent crops | 35% |
| Global crop production directly attributable to animal pollination | 5–8% (US$235–577 billion a year, 2015 dollars) |
| Growth in production of pollinator-dependent crops over five decades | 300% |
| Vertebrate pollinators threatened with global extinction | 16.5% (30% for island species) |
| Bee species threatened where national Red Lists exist | Often more than 40% may be threatened |
There is no global Red List assessment for insect pollinators such as bees; regional and national assessments show high levels of threat for some bees and butterflies (IPBES).
Honeybees in Japan, 1960 to 2026
| Year (1 Jan) | Beekeepers | Colonies | Source |
|---|---|---|---|
| 1960 | 9,297 | 110,000 | National Diet Library (from MAFF) |
| 1970 | 9,659 | 243,000 | National Diet Library (from MAFF) |
| 1980 | 10,918 | 320,000 | National Diet Library (from MAFF) |
| 1990 | 8,281 | 253,000 | National Diet Library (from MAFF) |
| 2000 | 5,342 | 184,000 | National Diet Library (from MAFF) |
| 2010 | 5,353 | 175,000 | National Diet Library (from MAFF) |
| 2012 | 5,934 | 184,000 | MAFF (Nov 2026) |
| 2013 | 8,312 | 204,000 | MAFF (Nov 2026) |
| 2016 | 9,452 | 212,000 | MAFF (Nov 2026) |
| 2019 | 9,782 | 215,000 | MAFF (Nov 2026) |
| 2022 | 11,276 | 242,000 | MAFF (Nov 2026) |
| 2024 | 12,061 | 236,000 | MAFF (Nov 2026) |
| 2025 | 12,164 | 241,000 | MAFF (Nov 2026) |
| 2026 | 12,131 | 240,000 | MAFF (Nov 2026) |
According to the National Diet Library, beekeepers and colonies in Japan peaked in 1979 and then kept falling, which it attributes to changes in the natural environment, a rise in cheap imported honey and the ageing of beekeepers (National Diet Library, 2022). MAFF reports 12,131 beekeepers and 240,000 colonies on 1 January 2026; beekeepers have tended to increase since 2018 while colonies have been roughly flat. Colonies per beekeeper fell from 31.1 in 2012 to 19.8 in 2026 (MAFF). Colonies are counted on 1 January and grow from spring, more than doubling by summer (MAFF, 2019).
Beekeepers by size and the Japanese honeybee, 2012 to 2026
| Year (1 Jan) | Beekeepers | With fewer than 10 colonies | With 10 or more | Keeping Japanese honeybees | Colonies | Of which Japanese honeybee | Colonies per beekeeper |
|---|---|---|---|---|---|---|---|
| 2012 | 5,934 | 3,286 | 2,648 | – | 184,000 | – | 31.1 |
| 2016 | 9,452 | 6,351 | 3,101 | – | 212,000 | – | 22.4 |
| 2020 | 10,021 | 6,952 | 3,069 | – | 213,000 | – | 21.3 |
| 2024 | 12,061 | 8,635 | 3,426 | – | 236,000 | – | 19.6 |
| 2025 | 12,164 | 8,689 | 3,475 | 6,094 | 241,000 | 25,000 | 19.8 |
| 2026 | 12,131 | 8,740 | 3,391 | 6,584 | 240,000 | 28,000 | 19.8 |
Honey production and self-sufficiency in Japan, 2017 to 2025
| Year | Domestic production (t) | Imports (t) | Consumption (t) | Self-sufficiency (%) |
|---|---|---|---|---|
| 2017 | 2,827 | 42,821 | 45,627 | 6.2 |
| 2018 | 2,826 | 44,521 | 47,329 | 6.0 |
| 2019 | 2,911 | 44,788 | 47,689 | 6.1 |
| 2020 | 2,929 | 49,348 | 52,259 | 5.6 |
| 2021 | 2,779 | 47,132 | 49,844 | 5.5 |
| 2022 | 2,549 | 47,276 | 49,805 | 5.1 |
| 2023 | 2,636 | 41,924 | 44,539 | 5.9 |
| 2024 | 2,660 | 45,416 | 48,054 | 5.5 |
| 2025 | 2,431 | 51,644 | 54,051 | 4.5 |
Japan produced 2,431 tonnes of honey in 2025; MAFF notes that shifts in flowering times caused by unseasonable weather affected harvests. Consumption was about 54,000 tonnes and self-sufficiency 4.5%. Of the 51,644 tonnes imported, 36,765 tonnes (71.2%) came from China. The average wholesale price of domestic honey was 2,200 yen per kg; the CIF import price of Chinese honey was 267 yen per kg (MAFF).
Economic value of pollination in Japan and harm to honeybees, 2020 to 2025
| Item | Figure | Date |
|---|---|---|
| Economic effect of crop pollination (estimate) | About 670 billion yen (western honey bees about 180 billion yen) | NARO estimate (March 2022) |
| Output of crops grown from seed produced in Japan with honeybee pollination (estimate) | About 120–220 billion yen | Same |
| Domestic output of honey and bee products (estimate) | About 7.7 billion yen (7.617–7.766 billion yen) | 2025 |
| Of which honeybees for pollination | About 80,000 colonies, about 2.23–2.39 billion yen | 2025 |
| Area of nectar plants | 78,900 ha (132,000 ha in 2017) | 2025 |
| Year | Reported damage suspected to be from pesticides | Varroosis (mites) notifications | Foulbrood notifications |
|---|---|---|---|
| 2020 | 29 cases | – | – |
| 2021 | 15 cases | – | – |
| 2022 | 20 cases | 26 cases, 505 colonies | 26 cases, 106 colonies |
| 2023 | 10 cases | 24 cases, 595 colonies | 16 cases, 56 colonies |
| 2024 | 15 cases | 37 cases, 928 colonies | 9 cases, 16 colonies |
| 2025 | 15 cases | 38 cases, 1,517 colonies | 10 cases, 31 colonies |
Honeybees by prefecture, ranking on 1 January 2026
| Rank | Colonies | Beekeepers | ||
|---|---|---|---|---|
| 1 | Okinawa | 22,300 | Nagano | 590 |
| 2 | Nagano | 19,000 | Gifu | 494 |
| 3 | Kagoshima | 14,000 | Fukuoka | 485 |
| 4 | Kumamoto | 13,900 | Chiba | 470 |
| 5 | Chiba | 11,800 | Shizuoka | 411 |
| 6 | Fukuoka | 11,100 | Aichi | 400 |
| 7 | Wakayama | 10,900 | Hiroshima | 399 |
| 8 | Nagasaki | 7,400 | Nagasaki | 398 |
| 9 | Shizuoka | 7,200 | Hyogo | 388 |
| 10 | Fukushima | 7,200 | Kagoshima | 382 |
| Japan | 240,000 | Japan | 12,131 |
Kyushu, Okinawa and Saga Prefecture, 1 January 2025
| Prefecture | Beekeepers | Colonies | National rank by colonies | Honey production (kg, 2024) |
|---|---|---|---|---|
| Okinawa | 344 | 23,257 | 1 | 23,567 |
| Kumamoto | 270 | 13,698 | 4 | 244,170 |
| Kagoshima | 351 | 12,911 | 5 | 28,355 |
| Fukuoka | 444 | 10,426 | 6 | 89,468 |
| Nagasaki | 317 | 6,471 | 11 | 37,783 |
| Oita | 288 | 5,843 | 15 | 54,975 |
| Miyazaki | 218 | 4,838 | 21 | 24,673 |
| Saga | 154 | 3,207 | 28 | 18,236 |
| Japan | 12,150 | 241,805 | 2,618,158 |
On 1 January 2025, Saga Prefecture had 154 beekeepers and 3,207 colonies, 28th of 47 prefectures and 7th of the 7 Kyushu prefectures by colonies. Honey production in 2024 was 18,236 kg, 35th of the 43 prefectures with a value (Wakayama Prefecture table; our calculation). In Saga, beekeepers report their colonies as of 1 January to a livestock hygiene service centre by the end of January each year, including the number of Japanese honeybee colonies; Karatsu City and Genkai Town are covered by the Northern centre (Saga Prefecture). We have not found Saga's 2026 figure or any figure for Karatsu City.
Karatsu: our own figures
| Fiscal year | Japanese honeybee colonies | Basis |
|---|---|---|
| FY2025 | 5 | Plan (not an actual count) |
| FY2026 | 8 | Actual |
We keep Japanese honeybees in the Yokomakura area of Ochi, Karatsu City, together with students of Karatsu Minami High School and local residents (Karatsu Honeybee Project, in Japanese). We kept 8 colonies in FY2026 (actual). For FY2025 we planned 5 colonies (a plan, not an actual count). Because the dates of counting differ, we do not show this as a share of the national (240,000) or Saga (3,207) totals.
To cite these figures, or to ask about environmental learning, training or visits on honeybees and pollinators, see Citing this page and enquiries below.
Frequently asked questions
Q1. Are honeybees declining?
The number of managed beehives worldwide is rising: FAO statistics show about 69.38 million in 1990 and about 101.71 million in 2024. IPBES (2016) found that managed western honey bee hives increased globally over five decades, while declines were recorded in some European countries and North America, and that 9% of bee and butterfly species in Europe are threatened. In Japan, colonies peaked at 326,000 in 1979, fell to 175,000 in 2010 and stood at 240,000 on 1 January 2026; hobby beekeepers were added to the registration requirement from 2013, so figures before and after are not directly comparable.
Q2. How many honeybee colonies are there in Japan?
According to the Ministry of Agriculture, Forestry and Fisheries (MAFF), there were 240,000 colonies kept by 12,131 beekeepers on 1 January 2026, including 28,000 colonies of the Japanese honeybee kept by 6,584 beekeepers. One colony is one hive with a queen and about 20,000 workers; the count is taken on 1 January and colonies more than double by summer.
Q3. Which country has the most beehives?
In FAO data for 2024, India ranks first with about 12.65 million hives, mainland China second with about 9.36 million and Türkiye third with about 8.96 million. The values for India and mainland China are imputed by FAO.
Q4. Which Japanese prefecture has the most honeybees?
On 1 January 2026, Okinawa had the most colonies (22,300) followed by Nagano (19,000). Nagano had the most beekeepers (590) (MAFF).
Q5. How many honeybees are there in Saga Prefecture?
On 1 January 2025, Saga had 154 beekeepers and 3,207 colonies, 28th of 47 prefectures and 7th of the 7 Kyushu prefectures by colonies (our calculation). Honey production in 2024 was 18,236 kg (Wakayama Prefecture table compiled from prefectural surveys).
Q6. What is Japan's honey self-sufficiency rate?
In 2025 Japan produced 2,431 tonnes of honey and consumed 54,051 tonnes, a self-sufficiency rate of 4.5%. China supplied 71.2% of the 51,644 tonnes imported (MAFF).
Q7. What would happen to food without pollinators?
IPBES (2016) estimates that more than three quarters of the leading types of global food crops rely to some extent on animal pollination, and that 5 to 8% of global crop production, worth US$235 billion to US$577 billion a year (2015 dollars), is directly attributable to animal pollination. In Japan, the National Agriculture and Food Research Organization (NARO) estimates the economic effect of crop pollination at about 670 billion yen, of which western honey bees account for about 180 billion yen.
Source register
| Document | Publisher | Date | URL | Accessed |
|---|---|---|---|---|
| Current Situation of Beekeeping (Yoho wo meguru josei), November 2026 | MAFF Livestock Industry Bureau | 2026-11 | https://www.maff.go.jp/j/chikusan/kikaku/lin/sonota/attach/pdf/bee-144.pdf | 2026-11-18 |
| Beekeeping (MAFF page listing the documents) | MAFF | 2026-11 | https://www.maff.go.jp/j/chikusan/kikaku/lin/sonota/bee.html | 2026-11-18 |
| Current Situation of Beekeeping, November 2019 | MAFF | 2019-11 | https://www.maff.go.jp/j/chikusan/kikaku/lin/sonota/attach/pdf/hachimeguji.pdf | 2026-11-18 |
| Trends in Beekeeping in Japan (Issue Brief No. 1185) | National Diet Library, Research and Legislative Reference Bureau | 2022-03-28 | https://dl.ndl.go.jp/view/download/digidepo_12198739_po_1185.pdf?contentNo=1 | 2026-11-18 |
| Wakayama livestock statistics 2025 (table of beekeepers, colonies and honey production by prefecture) | Wakayama Prefecture Livestock Division | 2025 | https://www.pref.wakayama.lg.jp/prefg/070400/chikusan_top_d/fil/wakayamatikusan2025.pdf | 2026-11-18 |
| To those keeping honeybees | Saga Prefecture Livestock Division | 2025-12-26 | https://www.pref.saga.lg.jp/kiji00320818/index.html | 2026-11-18 |
| FAOSTAT Crops and livestock products (Bees, Natural honey) | Food and Agriculture Organization of the United Nations (FAO) | 2025-12 (bulk data update) | https://www.fao.org/faostat/en/#data/QCL | 2026-11-18 |
| Summary for policymakers of the IPBES assessment report on pollinators, pollination and food production (UNEP/CBD/SBSTTA/20/INF/70) | IPBES (circulated by the CBD Secretariat) | 2016-04-15 | https://www.cbd.int/doc/meetings/sbstta/sbstta-20/information/sbstta-20-inf-70-en.pdf | 2026-11-18 |
Notes on reading the figures
Japan's beekeeper and colony counts are compiled by MAFF from registrations under the Apiculture Promotion Act reported by prefectures, as of 1 January each year. Hobby beekeepers were added from 2013, so earlier figures are not directly comparable. FAO country values mix official figures with FAO estimates and imputations, so the basis of the value differs by country. The prefectural table (1 January 2025) predates MAFF's November 2026 revision of the national totals. Our own colony counts are by fiscal year and are not taken on 1 January.
What this page does not cover
This page does not cover counts of individual wild bee species such as bumblebees, assessments of individual pesticides, honey quality or health effects, or municipal figures (we have not found a figure for Karatsu City). For threatened species see Endangered Species in Numbers; for biodiversity overall see Biodiversity in Numbers; for estimates of the nature-positive economy see Nature-Positive Economy in Numbers.
Citing this page and enquiries
To cite figures from this page or to ask about environmental learning, training or visits on honeybees and pollinators for schools and companies, please use our contact page or write to info@karatsu-f-f.com.
About this page
By Hiroaki Kojima (Vice Director, Karatsu Farm & Food) / Contact: info@karatsu-f-f.com (contact page) / Published: 18 November 2026 / Markdown: bee-data.mdThis page is made together with AI. See this data bank and AI for how.
Related links
▶ Karatsu Data Bank
▶ Nature-Positive Economy in Numbers
▶ Endangered Species in Numbers
▶ Biodiversity in Numbers
▶ ミツバチの数と減少の推移2026(日本語)