
How much pine wilt damage is there in Japan? (FY2025)
Damage from pine wilt disease (matsukuimushi) in Japan was about 630,000 m³ in FY2025, 163% of the previous year. It peaked at 2.43 million m³ in FY1979, declined over the long term to 250,000 m³ in FY2022, rose in FY2023 for the first time in 12 years, and reached 390,000 m³ in FY2024 and 630,000 m³ in FY2025 (Forestry Agency, national pine wilt damage FY1977-FY2025, Forestry Agency, pine wilt damage, 30 September 2026). By prefecture, Yamagata had the most (323.8 thousand m³); Saga had 1.0 thousand m³ and ranked 32nd, tied with Oita (Forestry Agency, damage by prefecture, sorted by us).
This page was made by Karatsu Farm & Food as part of the Karatsu Data Bank. It looks at pine wilt in the world (distribution, and China, South Korea and Europe), Japan (the trend, a ranking of 47 prefectures, coastal pine forests), Saga (damage in private forests) and Karatsu (Niji-no-Matsubara). How forests and coastal forests protect daily life is on our green infrastructure data page, and overall figures for species and ecosystems on our biodiversity data page.
| Question | Figure | Period | Source |
|---|---|---|---|
| Damage nationwide | about 630,000 m³ | FY2025 | Forestry Agency |
| Change from the previous year | 163% | FY2025 | Forestry Agency |
| Peak damage | 2.43 million m³ | FY1979 | Forestry Agency |
| Lowest damage | 250,000 m³ | FY2022 | Forestry Agency |
| Prefectures with damage | 46, all except Hokkaido | by FY2025 | Forestry Agency |
| Top prefecture | Yamagata 323.8 thousand m³ | FY2025 | Forestry Agency (sorted by us) |
| Saga's rank | 32nd (1.0 thousand m³) | FY2025 | Forestry Agency (sorted by us) |
| Damaged trees at Niji-no-Matsubara | 1,026 (443.78 m³) | FY2025 | Saga District Forest Office |
Pine wilt disease in the world: where has it spread?
The pine wood nematode (Bursaphelenchus xylophilus), which causes pine wilt disease, is believed to be native to North America, where it is widespread in Canada and the United States. It was introduced to China (including Taiwan) and Korea and found there in the mid to late 1980s; in Europe it was first found in Portugal in 1999 and in Spain in 2008 (IPPC (FAO), Diagnostic Protocol DP 10, p. DP 10-2). In Japan it was first confirmed in Nagasaki in 1905 (Forestry Agency, coastal disaster prevention forests, p. 2).
| Country or area | EPPO status | Note |
|---|---|---|
| Canada, United States | widespread | believed native range |
| Japan | widespread | Honshu, Kyushu, Shikoku, Ryukyu; first reported in Nagasaki in 1905 |
| Taiwan | widespread | |
| China | present, no details | records by province |
| South Korea | restricted | |
| Mexico | present, no details | |
| Portugal | restricted | including Madeira; first in Europe in 1999 |
| Spain | restricted | first found in 2008 |
| France | few occurrences | |
| Armenia | restricted |
EPPO lists the nematode on its A2 list of pests recommended for regulation, and the EU treats it as a quarantine pest (EPPO Datasheet). In February 2025 the Government of Galicia, Spain, considered that eradication in the As Neves outbreak area was no longer possible and moved it to containment (EPPO Reporting Service 2025/077).
China's National Forestry and Grassland Administration reports that compared with 2020, the outbreak area in 2025 was 12.3611 million mu (45.55%) smaller, pine trees killed by the disease were 15.0694 million (77.65%) fewer, and affected county-level and township-level areas fell by 100 (13.77%) and 1,296 (23.65%). The disease is still present in about one fifth of county-level divisions and one tenth of townships (NFGA Biological Disaster Prevention and Control Center, bulletin 2026 no. 1, 20 January 2026). At the end of 2020, the baseline, it was present in 726 county-level divisions in 18 provinces, autonomous regions and municipalities, over 27.1382 million mu (article reposted on the NFGA website, pine wilt control data). Mu is a Chinese unit of area.
| Control period (June-May) | Pine trees killed by the disease |
|---|---|
| ’22 | 380,000 |
| ’23 | 1,070,000 |
| ’24 | 900,000 |
| ’25 | 1,490,000 |
| ’26 | 1,770,000 |
Pine wilt damage in Japan, FY1977-FY2025
National damage rose from 810,000 m³ in FY1977 to 2.43 million m³ two years later in FY1979, then fell with ups and downs to 250,000 m³ in FY2022. It rose in FY2023 for the first time in 12 years, owing among other things to a hot, dry summer (Forestry Agency, FY2025 Annual Report on Forest and Forestry, p. 86). By FY2025 damage had occurred in 46 prefectures, all except Hokkaido, and it increased from the previous year in 32 of them (Forestry Agency, about pine wilt damage).
| Fiscal year | Damage (m³) |
|---|---|
| FY1977 | 810,000 |
| FY1978 | 2,070,000 |
| FY1979 | 2,430,000 |
| FY1980 | 2,100,000 |
| FY1981 | 2,070,000 |
| FY1982 | 1,470,000 |
| FY1983 | 1,240,000 |
| FY1984 | 1,330,000 |
| FY1985 | 1,260,000 |
| FY1986 | 1,210,000 |
| FY1987 | 1,140,000 |
| FY1988 | 1,050,000 |
| FY1989 | 910,000 |
| FY1990 | 950,000 |
| FY1991 | 1,150,000 |
| FY1992 | 1,130,000 |
| FY1993 | 1,000,000 |
| FY1994 | 1,120,000 |
| FY1995 | 1,010,000 |
| FY1996 | 920,000 |
| FY1997 | 810,000 |
| FY1998 | 760,000 |
| FY1999 | 720,000 |
| FY2000 | 840,000 |
| FY2001 | 910,000 |
| FY2002 | 910,000 |
| FY2003 | 800,000 |
| FY2004 | 730,000 |
| FY2005 | 690,000 |
| FY2006 | 640,000 |
| FY2007 | 620,000 |
| FY2008 | 630,000 |
| FY2009 | 590,000 |
| FY2010 | 580,000 |
| FY2011 | 650,000 |
| FY2012 | 640,000 |
| FY2013 | 630,000 |
| FY2014 | 560,000 |
| FY2015 | 480,000 |
| FY2016 | 440,000 |
| FY2017 | 400,000 |
| FY2018 | 350,000 |
| FY2019 | 300,000 |
| FY2020 | 300,000 |
| FY2021 | 260,000 |
| FY2022 | 250,000 |
| FY2023 | 310,000 |
| FY2024 | 390,000 |
| FY2025 | 630,000 |
Pine wilt damage by prefecture (FY2025)
| Rank | Prefecture | FY2025 (thousand m³) | FY2024 (thousand m³) | Change | FY2021 (thousand m³) |
|---|---|---|---|---|---|
| 1 | Yamagata | 323.8 | 108.8 | 298% | 25.2 |
| 2 | Nagano | 53.2 | 60.7 | 88% | 52.7 |
| 3 | Akita | 35.6 | 30.7 | 116% | 8.9 |
| 4 | Fukushima | 28.8 | 24.8 | 116% | 29.8 |
| 5 | Niigata | 19.5 | 18.8 | 103% | 5.3 |
| 6 | Kagoshima | 17.3 | 13.2 | 131% | 5.1 |
| 7 | Iwate | 16.1 | 13.2 | 122% | 18.8 |
| 8 | Yamaguchi | 12.6 | 12.4 | 102% | 12.3 |
| 9 | Okinawa | 12.1 | 14.6 | 83% | 2.0 |
| 10 | Hiroshima | 11.0 | 9.4 | 116% | 9.5 |
| 11 | Miyazaki | 10.0 | 10.6 | 94% | 1.7 |
| 12 | Miyagi | 9.7 | 9.0 | 108% | 10.1 |
| 13 | Tottori | 8.3 | 7.1 | 117% | 6.3 |
| 13 | Kagawa | 8.3 | 5.5 | 152% | 5.5 |
| 15 | Kyoto | 8.0 | 3.5 | 227% | 2.3 |
| 16 | Shizuoka | 7.8 | 7.2 | 108% | 4.7 |
| 17 | Shimane | 6.9 | 6.6 | 104% | 3.6 |
| 18 | Tokyo | 5.8 | 0.7 | 773% | 0.9 |
| 19 | Tochigi | 4.4 | 4.7 | 93% | 5.6 |
| 20 | Fukuoka | 3.9 | 3.1 | 127% | 4.5 |
| 21 | Ishikawa | 3.8 | 4.3 | 89% | 6.7 |
| 22 | Aichi | 3.3 | 0.7 | 457% | 0.8 |
| 23 | Okayama | 3.2 | 2.8 | 114% | 2.5 |
| 24 | Yamanashi | 2.5 | 3.2 | 80% | 3.7 |
| 25 | Hyogo | 2.3 | 0.9 | 267% | 3.1 |
| 26 | Shiga | 1.8 | 0.8 | 233% | 0.2 |
| 27 | Ibaraki | 1.6 | 1.0 | 161% | 1.4 |
| 27 | Ehime | 1.6 | 1.6 | 96% | 2.9 |
| 29 | Fukui | 1.4 | 1.1 | 125% | 1.3 |
| 30 | Aomori | 1.1 | 0.4 | 297% | 0.2 |
| 30 | Kumamoto | 1.1 | 0.8 | 132% | 1.3 |
| 32 | Saga | 1.0 | 0.4 | 255% | 0.3 |
| 32 | Oita | 1.0 | 0.6 | 172% | 0.2 |
| 34 | Nagasaki | 0.8 | 0.5 | 153% | 11.5 |
| 35 | Gunma | 0.7 | 2.6 | 25% | 3.1 |
| 36 | Chiba | 0.6 | 0.5 | 120% | 0.9 |
| 36 | Gifu | 0.6 | 0.3 | 234% | 0.3 |
| 36 | Mie | 0.6 | 0.8 | 72% | 0.3 |
| 36 | Wakayama | 0.6 | 0.5 | 114% | 1.1 |
| 40 | Nara | 0.5 | 0.6 | 78% | 0.5 |
| 41 | Tokushima | 0.3 | 0.2 | 134% | 0.3 |
| 42 | Toyama | 0.2 | 0.2 | 88% | 0.4 |
| 43 | Kanagawa | 0.1 | 0.2 | 74% | 0.5 |
| 43 | Kochi | 0.1 | 0.0 | 121% | 0.1 |
| - | Osaka | - | 0.0 | all gone | 0.5 |
| - | Saitama | - | - | *** | 0.0 |
| - | Hokkaido | - | - | *** | - |
| Japan | 633.6 | 389.6 | 163% | 258.7 |
In FY2025 Yamagata had 323.8 thousand m³, 298% of the previous year and 51.1% of Japan (our calculation), followed by Nagano (53.2), Akita (35.6), Fukushima (28.8) and Niigata (19.5). In Kyushu and Okinawa, Kagoshima (17.3), Okinawa (12.1) and Miyazaki (10.0) had the most. Hokkaido, Saitama and Osaka had no damage in FY2025 (Forestry Agency).
Coastal pine forests and protection forest areas (31 March 2025)
The Forestry Agency describes coastal forests as forests made to protect life along the coast from sea wind and salt, tsunamis and high waves, and blowing sand, and says that on dry, nutrient-poor coastal soil almost no tree other than pine can grow large and form a forest (Forestry Agency, pine wilt damage). Its leaflet says that pine wilt spread in the late 1960s and coastal disaster prevention forests declined (Forestry Agency, coastal disaster prevention forests, p. 2).
| Type of protection forest | Designated area (ha) | Actual area (ha) |
|---|---|---|
| Sand-drift prevention forest | 16,057 | 16,036 |
| Windbreak forest | 56,131 | 55,987 |
| Tide and salt damage prevention forest | 14,308 | 12,448 |
For control, prefectural governors and mayors designate "pine forests to be conserved", where prevention (spraying and trunk injection) and extermination (felling dead trees and fumigating, chipping or burning them) are carried out, while surrounding pine forests are converted to other species (Forestry Agency, about pine wilt damage). By FY2024 the Forest Tree Breeding Center had developed 624 resistant pine varieties, and 590,000 resistant pine seedlings were produced in FY2024, about 80% of pine seedlings (Annual Report, p. 87).
Pine wilt damage in Saga Prefecture (FY2020-FY2025)
In Forestry Agency figures, damage in Saga (private and national forests) was 0.3 thousand m³ in FY2021, 0.5 in FY2022, 0.6 in FY2023, 0.4 in FY2024 and 1.0 in FY2025, 255% of the previous year and about 0.16% of Japan (Forestry Agency, share our calculation). In FY2025, 0.6 thousand m³ was in private forests and 0.4 in national forests (Forestry Agency, private forests, national forests).
| Fiscal year | Karatsu City (m³) | Arita Town (m³) | Saga total (m³) |
|---|---|---|---|
| FY2020 | 141 | 30 | 171 |
| FY2021 | 97 | 30 | 127 |
| FY2022 | 236 | 30 | 266 |
| FY2023 | 242 | 30 | 272 |
| FY2024 | 192 | 30 | 222 |
| Total of 5 years | 908 | 150 | 1,058 |
Pine wilt at Niji-no-Matsubara, Karatsu (FY2025)
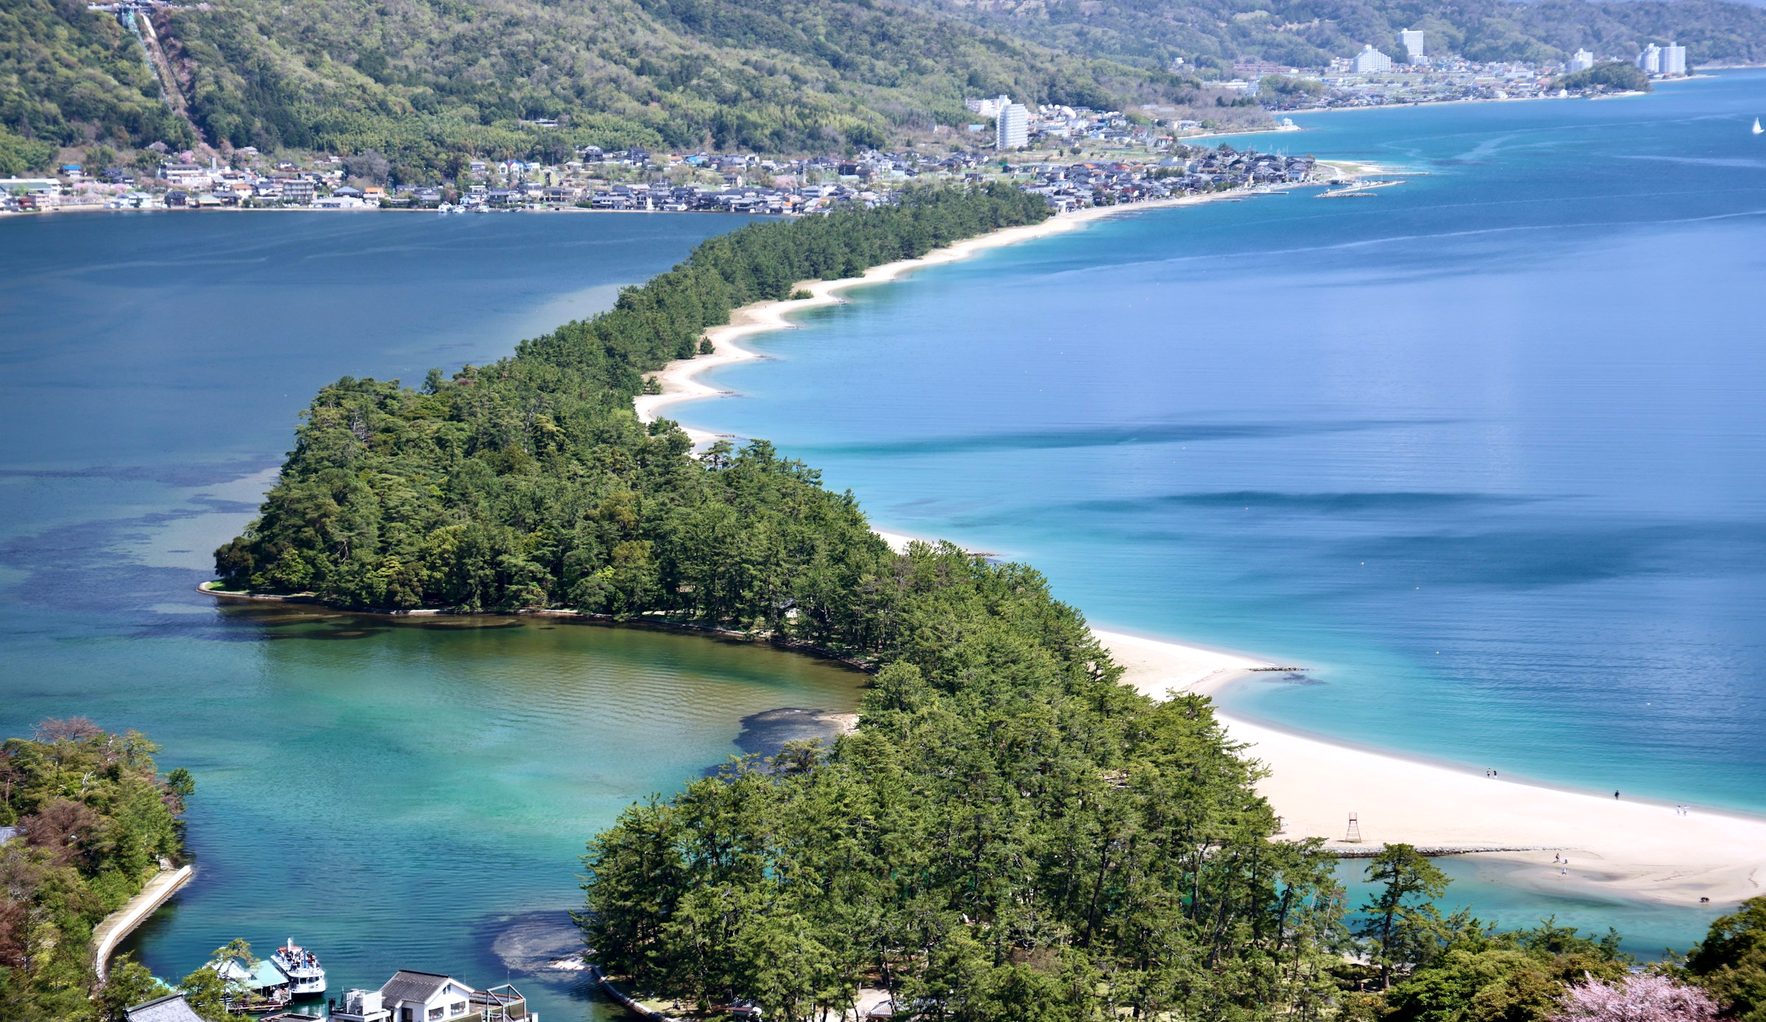
Niji-no-Matsubara, along Karatsu Bay, covers 214 ha with about one million pines, mainly Japanese black pine, according to the Kyushu Regional Forest Office, and has been managed as national forest since 1869 (Meiji 2) (Kyushu Regional Forest Office, Niji-no-Matsubara). It was designated a Special Place of Scenic Beauty on 24 March 1955 (Karatsu City, Saga Prefecture cultural properties). The Saga District Forest Office describes it as a coastal disaster prevention forest made to protect fields and homes from sea wind and blowing sand, about 4.5 km long and about 500 m wide (Saga District Forest Office, FY2026 priority actions, p. 1).
| Item | Figure | Period |
|---|---|---|
| Damaged trees | 1,026 | FY2025, felled and treated |
| Volume of damaged trees | 443.78 m³ | FY2025 |
| Average damaged trees over 5 years | 552.4 | FY2021-FY2025 |
| Past peak of damaged trees | 2,334 | FY1992 |
| Aerial spraying (prevention) | 146 ha | planned for FY2026 |
| Ground spraying (prevention) | 66 ha | planned for FY2026 |
| Trunk injection (prevention) | 64 trees | planned for FY2026 (black pine) |
We work with the Niji-no-Matsubara Project Team of Karatsu Minami High School on environmental conservation and environmental education in Karatsu, centred on Niji-no-Matsubara. The team develops products from pine needles, pine cones and other unused resources collected while cleaning the pine forest, and runs pine-cone workshops with local children; we have also given talks and workshops at local elementary schools together with the team (Niji-no-Matsubara Project Team (Japanese), ESD project). For environmental education or workshops at Niji-no-Matsubara, see "Citing this page and enquiries" below.
Frequently asked questions
Q1. How much pine wilt damage is there in Japan?
About 630,000 m³ in FY2025, 163% of the previous year. Damage rose in FY2023 for the first time in 12 years and has risen three years in a row (Forestry Agency, 30 September 2026).
Q2. When was pine wilt damage worst?
In FY1979, at 2.43 million m³. The lowest was 250,000 m³ in FY2022 (Forestry Agency).
Q3. Which prefectures have the most pine wilt damage?
In FY2025: 1 Yamagata 323.8 thousand m³, 2 Nagano 53.2, 3 Akita 35.6, 4 Fukushima, 5 Niigata (Forestry Agency figures sorted by us).
Q4. How much pine wilt damage is there in Saga?
1.0 thousand m³ in FY2025, 32nd, tied with Oita (Forestry Agency, sorted by us). In the prefecture's statistics, damage in private forests in FY2020-FY2024 occurred only in Karatsu City and Arita Town.
Q5. What causes pine wilt?
The Forestry Agency describes it as pine wilt disease, in which the pine wood nematode, an introduced nematode about 1 mm long, is carried by native Japanese pine sawyer beetles and others into pine trees and kills them (FY2025 Annual Report on Forest and Forestry).
Q6. How is pine wilt controlled?
In designated pine forests, by prevention (spraying and trunk injection) and by felling dead trees and fumigating, chipping or burning them; surrounding pine forests are converted to other species. Resistant pines make up about 80% of pine seedlings (Forestry Agency).
Q7. Is pine wilt disease found outside Japan?
Yes. The nematode is believed to be native to North America and has spread to China, South Korea, Taiwan, Portugal, Spain and elsewhere; it was first found in Europe in Portugal in 1999 and in Spain in 2008 (IPPC, EPPO). In South Korea 1.77 million pines were killed between June 2025 and May 2026 (Korea Forest Service).
Q8. How much damage is there at Niji-no-Matsubara?
According to the Saga District Forest Office, 1,026 damaged trees (443.78 m³) in FY2025 and an average of 552.4 a year in FY2021-FY2025. For FY2026 it plans 146 ha of aerial spraying, 66 ha of ground spraying and trunk injection of 64 trees.
Source register
| Document | Publisher | Date | URL | Accessed |
|---|---|---|---|---|
| National pine wilt damage (volume), FY1977-FY2025 | Forestry Agency | 2026-09-30 | https://www.rinya.maff.go.jp/j/hogo/higai/attach/pdf/matukui-10.pdf | 2026-11-20 |
| Pine wilt damage by prefecture (total), FY2021-FY2025 | Forestry Agency | 2026-09-30 | https://www.rinya.maff.go.jp/j/hogo/higai/attach/pdf/matukui-11.pdf | 2026-11-20 |
| Pine wilt damage by prefecture (private forests) | Forestry Agency | 2026-09-30 | https://www.rinya.maff.go.jp/j/hogo/higai/attach/pdf/matukui-12.pdf | 2026-11-20 |
| Pine wilt damage by prefecture (national forests) | Forestry Agency | 2026-09-30 | https://www.rinya.maff.go.jp/j/hogo/higai/attach/pdf/matukui-13.pdf | 2026-11-20 |
| About pine wilt damage | Forestry Agency | 2026-09-30 | https://www.rinya.maff.go.jp/j/hogo/higai/attach/pdf/matukui-14.pdf | 2026-11-20 |
| Pine wilt damage | Forestry Agency | updated 2026-09-30 | https://www.rinya.maff.go.jp/j/hogo/higai/matukui.html | 2026-11-20 |
| FY2025 Annual Report on Forest and Forestry, Chapter I-3 | Forestry Agency | 2026-05 | https://www.rinya.maff.go.jp/j/kikaku/hakusyo/r7hakusyo/attach/pdf/zenbun-13.pdf | 2026-11-20 |
| Toward coastal disaster prevention forests resilient to disasters | Forestry Agency | 2023-03 | https://www.maff.go.jp/j/pr/annual/pdf/kaigan_bousairin.pdf | 2026-11-20 |
| Saga Prefecture Forest and Forestry Statistics FY2025 | Saga Prefecture | 2025 | https://www.pref.saga.lg.jp/kiji00349514/3_49514_381374_up_wrdbmi7n.pdf | 2026-11-20 |
| Niji-no-Matsubara scenic forest | Kyushu Regional Forest Office | updated as needed | https://www.rinya.maff.go.jp/kyusyu/kanri/rekumori/nizimomatsubara-fuchi.html | 2026-11-20 |
| Special Place of Scenic Beauty Niji-no-Matsubara | Karatsu City | undated | https://www.city.karatsu.lg.jp/uploaded/attachment/15770.pdf | 2026-11-20 |
| Niji-no-Matsubara (cultural properties of Saga) | Saga Prefecture | updated as needed | https://www.pref.saga.lg.jp/kiji0031623/index.html | 2026-11-20 |
| FY2026 priority actions | Saga District Forest Office, Kyushu Regional Forest Office | 2026-05 | https://www.rinya.maff.go.jp/kyusyu/saisei_plan/attach/pdf/jyuten-21.pdf | 2026-11-20 |
| Aerial spraying against pine wilt at Niji-no-Matsubara | Saga District Forest Office | 2023-06 | https://www.rinya.maff.go.jp/kyusyu/saga/oshirase/attach/pdf/oshirase_R05-2.pdf | 2026-11-20 |
| Bursaphelenchus xylophilus - Distribution | EPPO | updated 2026-11-02 | https://gd.eppo.int/taxon/BURSXY/distribution | 2026-11-20 |
| Bursaphelenchus xylophilus Datasheet | EPPO | updated 2020-04-22 | https://gd.eppo.int/taxon/BURSXY/download/datasheet_pdf | 2026-11-20 |
| Update on the situation of Bursaphelenchus xylophilus in Spain (Reporting Service 2025/077) | EPPO | 2025 | http://gd.eppo.int/reporting/article-8090 | 2026-11-20 |
| DP 10: Bursaphelenchus xylophilus (ISPM 27 Annex 10) | IPPC Secretariat, FAO | adopted 2016 | https://www.ippc.int/static/media/files/publication/en/2017/07/DP_10_2016_En_2017-07-12.pdf | 2026-11-20 |
| Biological Disaster Prevention and Control bulletin 2026 no. 1 | National Forestry and Grassland Administration, China | 2026-01-20 | https://www.forestry.gov.cn/u/cms/fkzx/202607/01153405z28p.pdf | 2026-11-20 |
| Pine wilt control data (reposted article) | posted on the National Forestry and Grassland Administration website, China | 2023-05-19 | http://www.forestry.gov.cn/c/www/sl/502462.jhtml | 2026-11-20 |
| 2026 pine wilt control results (press release) | Korea Forest Service | 2026-06-25 | https://forest.go.kr/kfsweb/cmm/fms/FileDown.do?atchFileId=CTGRY_00000000410444&bbsId=BBSMSTR_1036&dwldHistYn=N&fileSn=5 | 2026-11-20 |
Notes on reading the figures
National damage is published by the Forestry Agency rounded to 10,000 m³; prefectural figures are rounded to 0.1 thousand m³. Ranks and shares are our sorting and calculation; the Forestry Agency does not publish rankings. Prefectures with the same rounded value share a rank. Damage is the volume of dead pine wood, not the area or number of trees. Saga's statistics cover private forests only, unlike the Forestry Agency's Saga figures (private and national forests). We have not checked the prefecture's figures for FY2017-FY2019, so they are not shown. For Niji-no-Matsubara's area we use the Kyushu Regional Forest Office's 214 ha. For China's fall in outbreak area we use the figure of the NFGA's Biological Disaster Prevention and Control Center. We could not confirm a published figure for China's total outbreak area in 2025.
What this page does not cover
How forests and coastal forests reduce disaster risk is on our green infrastructure data page, overall figures for species and ecosystems on our biodiversity data page, and Karatsu's temperature and rainfall on our Karatsu climate data page. This page does not cover other forest pests and diseases, oak wilt, timber prices, or the contents of the Niji-no-Matsubara restoration plans.
Citing this page and enquiries
To cite figures from this page, or to ask about environmental education or workshops at Niji-no-Matsubara or partnerships, please use our contact page or write to info@karatsu-f-f.com.
About this page
By Hiroaki Kojima (Vice Director, Karatsu Farm & Food) / Contact: info@karatsu-f-f.com (contact page) / Published: 20 November 2026 / Markdown: pine-wilt-data.mdThis page is made together with AI. See this data bank and AI for how.
Related links
▶ Karatsu Data Bank
▶ Niji-no-Matsubara Project Team (Japanese)
▶ ESD project
▶ Green infrastructure data
▶ Biodiversity data
▶ 松くい虫・松枯れの都道府県ランキング2026(日本語)