
How much travellers spend, and what they buy as souvenirs
In 2022 tourism spending in Karatsu City was JPY 22,673,214 thousand, of which JPY 4,433,703 thousand was spent on souvenirs. Souvenir spending in Saga Prefecture as a whole was JPY 29,483,601 thousand, 26% of tourism spending of JPY 113,901,304 thousand (Saga Prefecture Tourist Trends Survey (in Japanese)). This page sets out how much travellers spend, and how much of it goes on souvenirs and other shopping, using published figures from the Japan Tourism Agency, Saga Prefecture and Karatsu City.
This page was compiled by Karatsu Farm & Food, a nonprofit in Karatsu, Saga, as part of the Karatsu Data Bank. It lists figures and statements from the sources without conclusions or evaluations. Divisions, unit conversions (for example from 100 million yen to billion yen) and reordering are ours and are noted. English names for the Japanese categories are our translations. Visitor numbers (guest nights in Saga, visitors to Karatsu) and surveys of what travellers want to do are on Tourism in Numbers.
The figures come from four kinds of source: two Japan Tourism Agency surveys (domestic travel by Japanese residents, and overseas visitors) and the Saga Prefecture Tourist Trends Survey for Saga and Karatsu. Because methods and spending categories differ between sources, figures from different sources are not put in the same table. Combinations that should not be compared are listed under "Notes on reading the figures".
| Item | 2025 | Year on year |
|---|---|---|
| Travel spending (JPY billion) | 26,784.5 | +6.5% |
| of which overnight trips | 21,721.1 | +6.8% |
| of which day trips | 5,063.4 | +5.0% |
| Trips (million) | 553.13 | - |
| of which overnight trips | 299.97 | - |
| of which day trips | 253.16 | - |
| Spending per person per trip (yen) | 48,424 | +3.9% |
| of which overnight trips | 72,412 | +4.4% |
| of which day trips | 20,000 | +2.4% |
Japan: how much Japanese travellers spend on domestic trips (2025)
In 2025 Japanese residents spent JPY 26.78 trillion on domestic travel, 6.5% more than the year before: JPY 21.72 trillion on overnight trips and JPY 5.06 trillion on day trips. There were 553.13 million trips (299.97 million overnight, 253.16 million day trips). Spending per person per trip was 48,424 yen: 72,412 yen for overnight trips and 20,000 yen for day trips (Japan Tourism Agency (JTA), Travel and Tourism Consumption Trend Survey, 2025 annual results (final, in Japanese)).
| Item | Overnight trips | Day trips |
|---|---|---|
| Spending per person per trip (all purposes) | 72,412 yen | 20,000 yen |
| of which shopping during the trip | 8,366 yen | 4,038 yen |
| Shopping share (our calculation) | 11.6% | 20.2% |
| Total shopping spending | JPY 2,509.532 bn | JPY 1,022.238 bn |
| Spending per person per trip (sightseeing and recreation) | 82,270 yen | 20,416 yen |
| of which shopping during the trip | 9,379 yen | 4,552 yen |
| Item | Per person per trip (yen) | Share who bought |
|---|---|---|
| Confectionery | 1,775 | 42.9% |
| Farm produce | 384 | 9.5% |
| Seafood | 360 | 6.1% |
| Other food, drink, alcohol and tobacco | 1,037 | 25.2% |
| Textiles | 638 | 6.0% |
| Leather goods | 286 | 1.1% |
| Cosmetics etc. | 70 | 2.1% |
| Ceramics and glassware | 87 | 1.1% |
| Other souvenirs and shopping | 3,729 | 42.2% |
| All shopping | 8,366 | 74.8% |
| Item | Overnight (all purposes) | Overnight (sightseeing and recreation) | Day trips (all purposes) |
|---|---|---|---|
| Share who bought anything | 74.8% | 78.8% | 61.3% |
| Confectionery | 1,775 yen / 42.9% | 1,968 yen / 46.1% | 749 yen / 29.0% |
| Ceramics and glassware | 87 yen / 1.1% | 124 yen / 1.6% | 51 yen / 0.7% |
Japan: shopping during trips and what travellers buy as souvenirs (2025)
On overnight trips (all purposes), Japanese residents spent 8,366 yen on shopping during the trip out of 72,412 yen per person per trip. Spending during the trip was split into transport 18,447 yen, accommodation 18,205 yen, food and drink 9,721 yen, shopping 8,366 yen, tour and activity fees 5,075 yen and entertainment and other 4,624 yen. On day trips (all purposes), shopping was 4,038 yen out of 20,000 yen. Shopping was 11.6% of spending on overnight trips and 20.2% on day trips (our calculation; source: JTA, Travel and Tourism Consumption Trend Survey 2025).
On overnight trips 74.8% of travellers bought something. The shares buying each item were confectionery 42.9%, other souvenirs and shopping 42.2%, other food, drink, alcohol and tobacco 25.2%, farm produce 9.5%, seafood 6.1%, textiles 6.0%, cosmetics 2.1%, leather goods 1.1% and ceramics and glassware 1.1%. On overnight sightseeing and recreation trips the shares were 78.8% overall, 46.1% for confectionery (1,968 yen) and 1.6% for ceramics and glassware (124 yen). On day trips (all purposes) 61.3% bought something and 29.0% bought confectionery (749 yen).
| Item | Total (JPY billion) | Share | Per general visitor (yen) |
|---|---|---|---|
| Accommodation | 3,457.8 | 36.6% | 84,057 |
| Food and drink | 2,068.8 | 21.9% | 50,221 |
| Transport | 944.9 | 10.0% | 22,933 |
| Entertainment and services | 423.6 | 4.5% | 10,295 |
| Shopping | 2,554.1 | 27.0% | 61,136 |
| Other | 5.8 | 0.1% | 139 |
| Total | 9,454.9 | 100% | 228,782 |
| Item | Share who bought | Average per buyer (yen) |
|---|---|---|
| Anything | 98.46% | 62,094 |
| Confectionery | 72.68% | 11,127 |
| Alcohol | 21.96% | - |
| Folk crafts and traditional crafts | 8.34% | 13,692 |
Japan: how much overseas visitors spend and what they buy (2025)
In 2025 overseas visitors spent JPY 9.45 trillion in Japan, 16.4% more than the year before. By item: accommodation JPY 3.46 trillion (36.6%), shopping JPY 2.55 trillion (27.0%), food and drink JPY 2.07 trillion (21.9%), transport JPY 944.9 billion (10.0%) and entertainment and services JPY 423.6 billion (4.5%). Spending per general visitor was 228,782 yen, of which 61,136 yen was shopping (JTA, Consumption Trend Survey for Foreigners Visiting Japan, calendar 2025 (final, in Japanese)).
98.46% of visitors bought something during the trip, spending 62,094 yen on average. 72.68% bought confectionery (11,127 yen on average among buyers), 21.96% bought alcohol and 8.34% bought folk or traditional crafts (13,692 yen). Cruise passengers spent 28,357 yen per person (of which 25,315 yen on shopping), JPY 43.9 billion in total.
| Country or region | Spending per person (yen) | of which shopping (yen) | Total (JPY billion) | of which shopping (JPY billion) | Shopping, leisure trips (yen) |
|---|---|---|---|---|---|
| All visitors | 228,782 | 61,136 | 9,454.9 | 2,554.1 | 61,830 |
| South Korea | 105,058 | 25,639 | 990.6 | 242.3 | 25,556 |
| Taiwan | 184,413 | 60,079 | 1,203.3 | 395.5 | 59,870 |
| Hong Kong | 226,011 | 68,917 | 561.4 | 171.4 | 69,808 |
| China | 246,550 | 91,457 | 2,005.8 | 761.9 | 91,809 |
| Country or region | Share who bought anything | Average per buyer (yen) | Confectionery | Folk and traditional crafts | Alcohol |
|---|---|---|---|---|---|
| All visitors | 98.46% | 62,094 | 72.68% | 8.34% | 21.96% |
| South Korea | 98.72% | 25,971 | 83.4% | 3.94% | 37.27% |
| Taiwan | 99.37% | 60,457 | 79.0% | 5.14% | - |
| Hong Kong | 98.79% | 69,763 | 70.66% | 4.62% | - |
| China | 99.11% | 92,283 | 76.37% | 6.35% | - |
Shopping by visitors from South Korea, Taiwan, Hong Kong and China (Japan, 2025)
These four are the countries and regions whose visit rates to Saga are shown in the section on overseas visitors to Saga below. The amounts here are for Japan as a whole, not for spending in Saga. Shopping per person was 91,457 yen for China, 68,917 yen for Hong Kong, 60,079 yen for Taiwan and 25,639 yen for South Korea, against 61,136 yen for all visitors. Visitors from South Korea spent 105,058 yen per person and JPY 990.6 billion in total, of which JPY 242.3 billion on shopping (JTA, Consumption Trend Survey for Foreigners Visiting Japan 2025).
The share buying confectionery was 83.4% for South Korea, 79.0% for Taiwan, 76.37% for China and 70.66% for Hong Kong. 37.27% of visitors from South Korea bought alcohol. The share buying folk or traditional crafts was 6.35% for China, 5.14% for Taiwan, 4.62% for Hong Kong and 3.94% for South Korea.
| Item | 2025 | 2024 |
|---|---|---|
| Visitors to Saga | 4,869,040 | 3,669,580 |
| Sample size (people) | 210 | 140 |
| Visit rate | 0.009 | 0.007 |
| Spending per person (yen) | 23,090 | 24,240 |
| of which shopping (yen) | 4,880 | 4,920 |
| Travel spending (JPY billion) | 112.4186 | 88.9677 |
| of which shopping (JPY billion) | 23.7641 | 18.0656 |
Saga: spending and shopping by Japanese travellers (2025 and 2024)
According to the reference tables of the Japan Tourism Agency survey, about 4.87 million Japanese travellers visited Saga in 2025, spending 23,090 yen per person, of which 4,880 yen on shopping. Travel spending in Saga was JPY 112.4 billion, of which JPY 23.8 billion on shopping. In 2024 there were about 3.67 million visitors, spending 24,240 yen per person (shopping 4,920 yen), and travel spending was JPY 89.0 billion (shopping JPY 18.1 billion) (JTA, Travel and Tourism Consumption Trend Survey, reference tables by prefecture (2025, 2024)).
For sightseeing and recreation trips only, 2025 visitors numbered about 3.28 million, spending 22,430 yen per person (shopping 4,380 yen) and JPY 73.6 billion in total. For Saga, these values are estimated from 210 responses in 2025 and 140 in 2024. Prefecture-level spending excludes transport between prefectures.
| Item | 2025 | 2024 |
|---|---|---|
| Visitors to Saga | 264,950 | 225,882 |
| Visit rate | 0.6441% | 0.6343% |
| Sample size (visit rate / spending, people) | 483 / 477 | 539 / 528 |
| Spending per person (yen) | 45,684 | 50,744 |
| of which shopping (yen) | 10,745 | 19,226 |
| Travel spending (JPY billion) | 12.104 | 11.462 |
| of which shopping (JPY billion) | 2.847 | 4.343 |
| Country or region | Visit rate to Saga (responses) | Spending per person in Saga (yen) |
|---|---|---|
| South Korea | 1.0451% (170) | 36,784 |
| Taiwan | 0.945% (116) | 30,342 |
| Hong Kong | 1.087% (52) | 39,928 |
| China | 0.4838% (67) | 58,179 |
Saga: spending and shopping by overseas visitors (2025 and 2024)
According to the regional survey of the Consumption Trend Survey for Foreigners Visiting Japan, 264,950 overseas visitors (general visitors) visited Saga in 2025, spending 45,684 yen per person, of which 10,745 yen on shopping. Travel spending in Saga was JPY 12.104 billion, of which JPY 2.847 billion on shopping. In 2024 there were 225,882 visitors, spending 50,744 yen per person (shopping 19,226 yen), and travel spending was JPY 11.462 billion (shopping JPY 4.343 billion) (JTA, Consumption Trend Survey for Foreigners Visiting Japan, regional survey by prefecture (2025, 2024)).
In 2025, 49.29% of visitors to Saga spent money on shopping, 21,798 yen on average among them (240 responses). The average stay was 2.2 nights. For leisure trips only, there were 236,309 visitors spending 42,794 yen per person (shopping 10,532 yen) and JPY 10.113 billion in total. The share of visitors who went to Saga was 1.087% for Hong Kong, 1.0451% for South Korea, 0.945% for Taiwan and 0.4838% for China, and those who visited Saga spent 58,179 yen per person from China, 39,928 yen from Hong Kong, 36,784 yen from South Korea and 30,342 yen from Taiwan.
| Year | Tourism spending (JPY thousand) | Souvenirs (JPY thousand) | Souvenir share | Per person |
|---|---|---|---|---|
| 2018 | 133,528,333 | 44,188,384 | 33% | 3,502 yen |
| 2019 | 121,425,099 | 28,950,269 | 24% | 3,579 yen |
| 2020 | 80,946,373 | 17,552,693 | 22% | 3,827 yen |
| 2021 | 76,602,057 | 17,569,027 | 23% | 3,673 yen |
| 2022 | 113,901,304 | 29,483,601 | 26% | 4,082 yen |
Tourism and souvenir spending in Saga Prefecture (2018 to 2022)
In the prefecture's own estimate in the Saga Prefecture Tourist Trends Survey, annual tourism spending in Saga in 2022 was JPY 113,901,304 thousand, of which souvenirs JPY 29,483,601 thousand (26%). The other items were food and drink JPY 31,084,337 thousand (27%), transport JPY 20,238,449 thousand (18%), accommodation JPY 18,717,522 thousand (16%), admission fees JPY 10,156,113 thousand (9%) and other JPY 4,221,283 thousand (4%) (Saga Prefecture Tourist Trends Survey (in Japanese)).
Souvenir spending was JPY 44,188,384 thousand in 2018 (33%), JPY 28,950,269 thousand in 2019 (24%), JPY 17,552,693 thousand in 2020 (22%), JPY 17,569,027 thousand in 2021 (23%) and JPY 29,483,601 thousand in 2022 (26%). The per-person amount in the source was 3,502 yen in 2018 and 4,082 yen in 2022.
| Year | Tourism spending, total (JPY billion) | Japanese residents (JPY billion) | Overseas visitors (JPY billion) |
|---|---|---|---|
| 2018 | 262.8 | 235.7 | 27.1 |
| 2019 | 260.2 | 218.2 | 42.0 |
| 2020 | 155.0 | 152.4 | 2.6 |
| 2021 | 173.1 | 173.1 | 0 |
| 2022 | 160.5 | 160.2 | 0.3 |
Tourism spending in Saga Prefecture under the common standards (2018 to 2022)
Besides the prefecture's own estimate above, the Saga Prefecture Tourist Trends Survey also gives tourism spending under the Japan Tourism Agency's common standards for tourist arrival statistics. It was JPY 160.5 billion in 2022 (Japanese residents JPY 160.2 billion, overseas visitors JPY 0.3 billion) and JPY 260.2 billion in 2019 (Japanese residents JPY 218.2 billion, overseas visitors JPY 42.0 billion) (Saga Prefecture Tourist Trends Survey (in Japanese)). The two estimates use different methods and give different amounts for the same year, so this page does not compare them. The Japan Tourism Agency's compilation under the common standards ended with the release of March 2024.
| Year | Total | Accommodation | Food and drink | Souvenirs | Transport | Admission fees | Other | Per person |
|---|---|---|---|---|---|---|---|---|
| 2018 | 27,558,693 | 4,127,069 | 9,498,521 | 6,947,711 | 5,081,146 | 1,579,612 | 324,633 | 4,014 yen |
| 2019 | 23,809,520 | 6,016,248 | 7,832,177 | 5,416,866 | 3,306,399 | 843,094 | 394,736 | 6,111 yen |
| 2020 | 16,137,523 | 3,308,335 | 4,203,476 | 2,907,195 | 1,774,522 | 3,732,143 | 211,852 | 7,722 yen |
| 2021 | 14,697,043 | 2,635,642 | 4,007,083 | 2,771,463 | 1,691,646 | 3,389,260 | 201,949 | 7,371 yen |
| 2022 | 22,673,214 | 4,721,493 | 6,414,850 | 4,433,703 | 2,705,206 | 4,077,528 | 320,434 | 7,706 yen |
| Facility | 2021 | 2023 |
|---|---|---|
| Arpino | 24,676 | 47,014 |
| Michi-no-Eki Momoyama Tenkaichi | 147,687 | 184,815 |
| Michi-no-Eki Kyuragi Kaze-no-Furusato-kan | 151,028 | 169,684 |
Tourism spending by item and souvenir spending in Karatsu City (2018 to 2022)
In the municipal estimates of the Saga Prefecture Tourist Trends Survey, tourism spending in Karatsu City in 2022 was JPY 22,673,214 thousand: food and drink JPY 6,414,850 thousand, accommodation JPY 4,721,493 thousand, souvenirs JPY 4,433,703 thousand, admission fees JPY 4,077,528 thousand, transport JPY 2,705,206 thousand and other JPY 320,434 thousand. Spending per person was 7,706 yen (Saga Prefecture Tourist Trends Survey (in Japanese)).
Souvenir spending was JPY 5,416,866 thousand in 2019, JPY 2,907,195 thousand in 2020, JPY 2,771,463 thousand in 2021 and JPY 4,433,703 thousand in 2022. The 2018 figure was JPY 6,947,711 thousand, but Karatsu figures from 2019 onwards are not comparable with 2018 and earlier because the estimation method changed. This prefectural estimate ends with 2022, and this page does not give Karatsu souvenir spending for 2023 onwards.
The Karatsu City Tourism Destination Management Strategy Plan 2025 (in Japanese) gives tourism spending per person of 7,722 yen (2020) and 7,614 yen (2023). It does not say which survey the 2023 figure comes from. The same plan gives the number of people passing the tills in 2021 and 2023 at Arpino and two roadside stations; in 2023 they were 47,014 at Arpino, 184,815 at Michi-no-Eki Momoyama Tenkaichi and 169,684 at Michi-no-Eki Kyuragi Kaze-no-Furusato-kan.
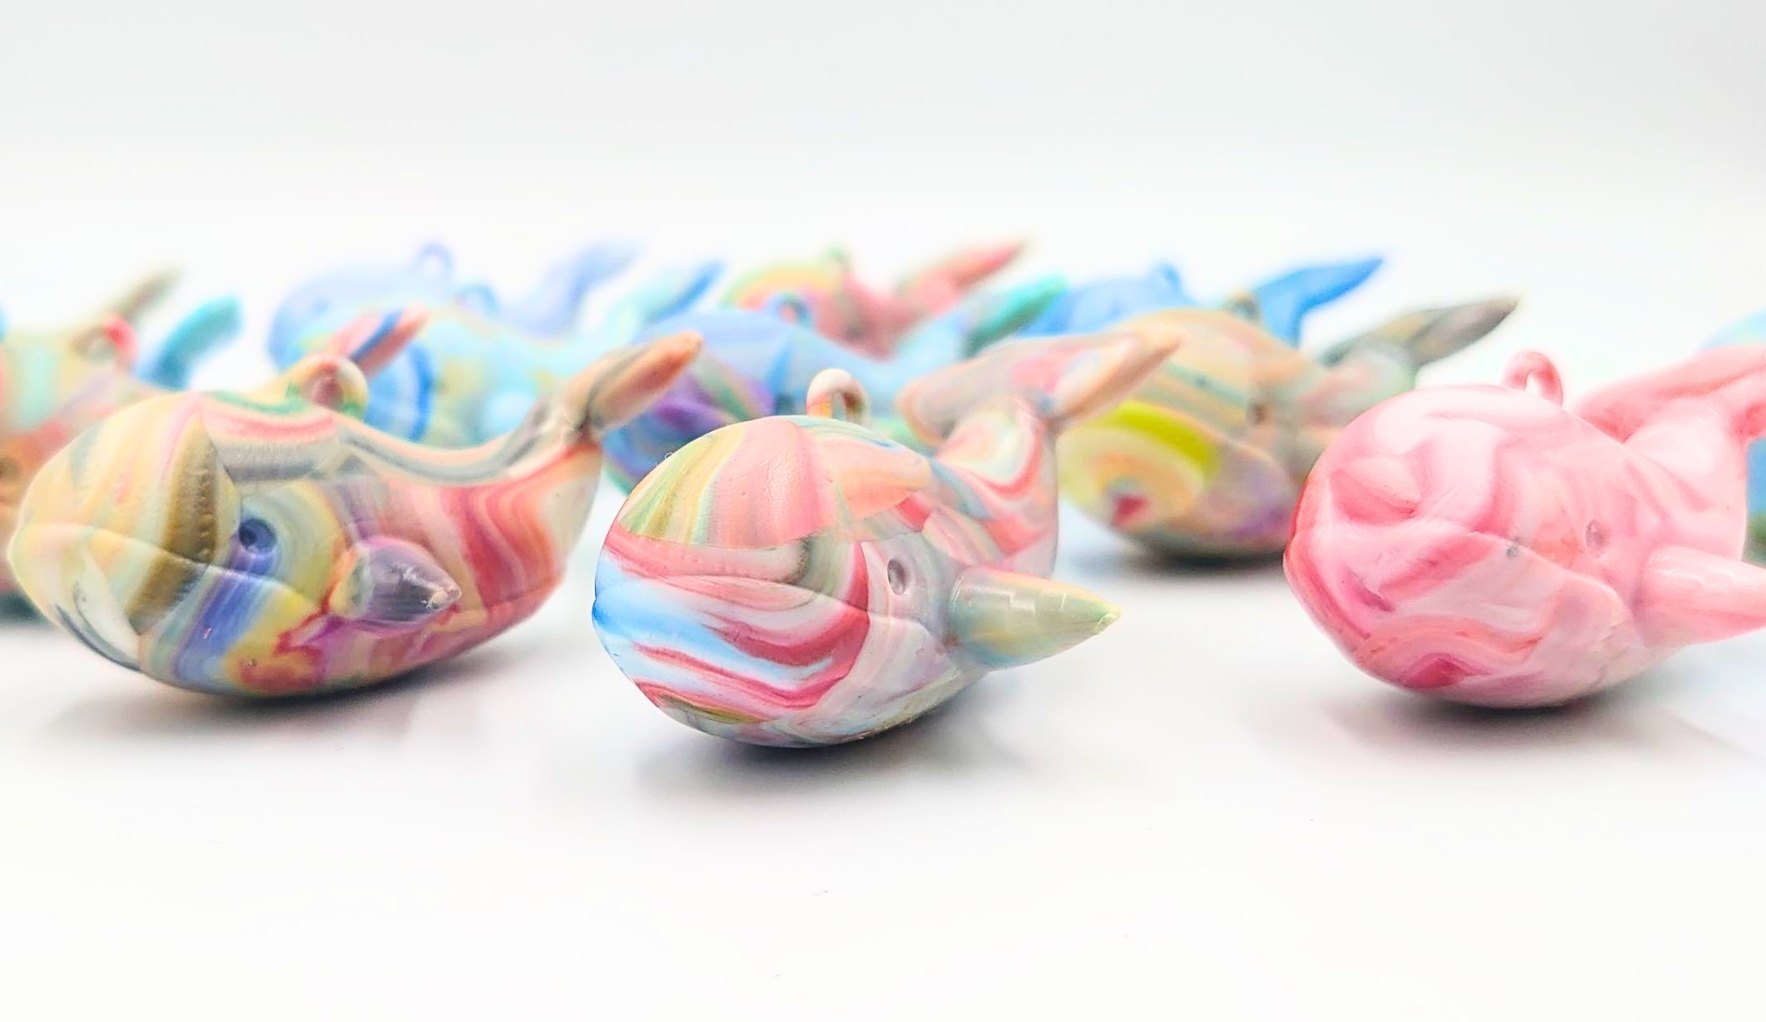
Karatsu Farm & Food makes souvenirs such as The Whale key ring from plastic bottle caps collected in Karatsu. Where to buy them is on The Whale: a Karatsu souvenir, and the project as a whole on Precious Plastic Karatsu.
FAQ
Q1. How much is spent on souvenirs in Karatsu City?
In 2022 it was JPY 4,433,703 thousand (about JPY 4.43 billion). Tourism spending in Karatsu that year was JPY 22,673,214 thousand. Karatsu figures from 2019 onwards are not comparable with 2018 (JPY 6,947,711 thousand) because the estimation method changed (Saga Prefecture Tourist Trends Survey).
Q2. How much do overseas visitors to Saga spend per person?
In 2025 overseas visitors (general visitors) to Saga spent 45,684 yen per person, of which 10,745 yen on shopping. Travel spending in Saga was JPY 12.104 billion (Japan Tourism Agency, Consumption Trend Survey for Foreigners Visiting Japan, regional survey).
Q3. What souvenirs do travellers buy most often?
On overnight domestic trips by Japanese residents in 2025 (all purposes), 42.9% bought confectionery, the highest share among the items in the source. Among overseas visitors, 72.68% bought confectionery (Japan Tourism Agency surveys).
Q4. How much do Japanese travellers to Saga spend on shopping?
In 2025 it was 4,880 yen per person, out of spending of 23,090 yen per person. Shopping spending in Saga totalled JPY 23.8 billion. These are reference values estimated from 210 responses for Saga (Japan Tourism Agency, Travel and Tourism Consumption Trend Survey, reference tables).
Q5. Are there figures for tourism or souvenir spending in Karatsu from 2023 onwards?
The municipal estimates of the Saga Prefecture Tourist Trends Survey end with 2022, and this page does not give souvenir spending for 2023 onwards. The Karatsu City Tourism Destination Management Strategy Plan 2025 gives tourism spending per person of 7,614 yen for 2023, but does not say which survey it comes from.
Sources
| Source | Publisher | Date | URL | Accessed |
|---|---|---|---|---|
| Travel and Tourism Consumption Trend Survey, 2025 annual results (final), summary | Japan Tourism Agency | 2026-04-30 | https://www.mlit.go.jp/kankocho/content/002027458.pdf | 2026-11-02 |
| Travel and Tourism Consumption Trend Survey, 2025 annual results (final), tables (Excel) | Japan Tourism Agency | 2026-04-30 | https://www.mlit.go.jp/kankocho/content/002027461.xlsx | 2026-11-02 |
| Travel and Tourism Consumption Trend Survey, reference tables by prefecture, 2025 (Excel) | Japan Tourism Agency | - | https://www.mlit.go.jp/kankocho/content/002027511.xlsx | 2026-11-02 |
| Travel and Tourism Consumption Trend Survey, reference tables by prefecture, 2024 (Excel) | Japan Tourism Agency | - | https://www.mlit.go.jp/kankocho/content/002027512.xlsx | 2026-11-02 |
| Consumption Trend Survey for Foreigners Visiting Japan, calendar 2025 (final), summary | Japan Tourism Agency | 2026-03-31 | https://www.mlit.go.jp/kankocho/content/002020046.pdf | 2026-11-02 |
| Consumption Trend Survey for Foreigners Visiting Japan, calendar 2025 (final), tables (Excel) | Japan Tourism Agency | 2026-03-31 | https://www.mlit.go.jp/kankocho/content/002025515.xls | 2026-11-02 |
| Consumption Trend Survey for Foreigners Visiting Japan, regional survey by prefecture, 2025 (Excel) | Japan Tourism Agency | - | https://www.mlit.go.jp/kankocho/content/002020056.xlsx | 2026-11-02 |
| Consumption Trend Survey for Foreigners Visiting Japan, regional survey by prefecture, 2024 (Excel) | Japan Tourism Agency | - | https://www.mlit.go.jp/kankocho/content/002020222.xlsx | 2026-11-02 |
| Saga Prefecture Tourist Trends Survey (2018 to 2022 editions) | Saga Prefecture, Tourism Division | Each year | https://www.pref.saga.lg.jp/kiji003106833/index.html | 2026-11-02 |
| Karatsu City Tourism Destination Management Strategy Plan 2025 | Karatsu City | - | https://www.city.karatsu.lg.jp/uploaded/attachment/17612.pdf | 2026-11-02 |
Notes on reading the figures
The figures on this page come from surveys with different methods. The following are not compared in the same table or sentence.
- The Saga Prefecture Tourist Trends Survey's own estimate (tourism spending of JPY 113,901,304 thousand in 2022) and the estimate under the common standards (JPY 160.5 billion for the same year) use different methods.
- Per-person amounts in the Saga Prefecture Tourist Trends Survey (Saga 3,502 to 4,082 yen, Karatsu 4,014 to 7,722 yen) and per-person spending in the Japan Tourism Agency surveys (for example 23,090 yen for Japanese visitors to Saga) are defined differently.
- Karatsu figures from 2019 onwards are not comparable with 2018 and earlier because the estimation method changed.
- Japan Tourism Agency figures for Saga are reference values from small samples: 210 responses for Japanese visitors in 2025, and 52 to 170 responses for each country or region of overseas visitors. Prefecture-level spending excludes transport between prefectures.
- National spending per trip and prefecture-level spending cover different scopes.
- The survey of domestic travel by Japanese residents and the survey of overseas visitors use different categories and cover different people.
- Visitor numbers on this page come from different surveys from the mobility-data visitor counts on Tourism in Numbers.
- Amounts for overseas visitors differ between tables: table 2-1 covers spending during the trip only, while figures 4 to 6 include the Japan portion of package tours. The 2025 figure for overseas visitor spending is the final calendar-year value (JPY 9,454.9 billion), which differs from the preliminary value.
What this page does not cover
Sales at souvenir shops, local produce shops and roadside stations in Karatsu are not given: Karatsu City documents give only the number of people passing the tills, and we have not checked other sources. Tourism and souvenir spending in Karatsu from 2023 onwards, comparisons between prefectures under the common standards, and shopping by country or region for Saga alone are also not given. The Saga Prefecture Tourist Trends Survey ends with 2022, the Japan Tourism Agency's compilation under the common standards ended with the March 2024 release, and the overseas visitor survey tables have no shopping by country or region for Saga alone. Visitor numbers and what travellers want to do are on Tourism in Numbers.
Citing this page and enquiries
To cite these figures, or to ask about finding local data, use our contact page or info@karatsu-f-f.com.
About this page
By Hiroaki Kojima (Vice Director, Karatsu Farm & Food) / Contact: info@karatsu-f-f.com (contact page) / Published 2 November 2026 / Markdown: tourism-spending-data.mdThis page is made together with AI. See this data bank and AI for how.
Related links
▶ Karatsu Data Bank
▶ Tourism in Numbers
▶ Hotel Sustainability in Numbers
▶ Population and Migration in Numbers
▶ Precious Plastic Karatsu
▶ 日本語版