
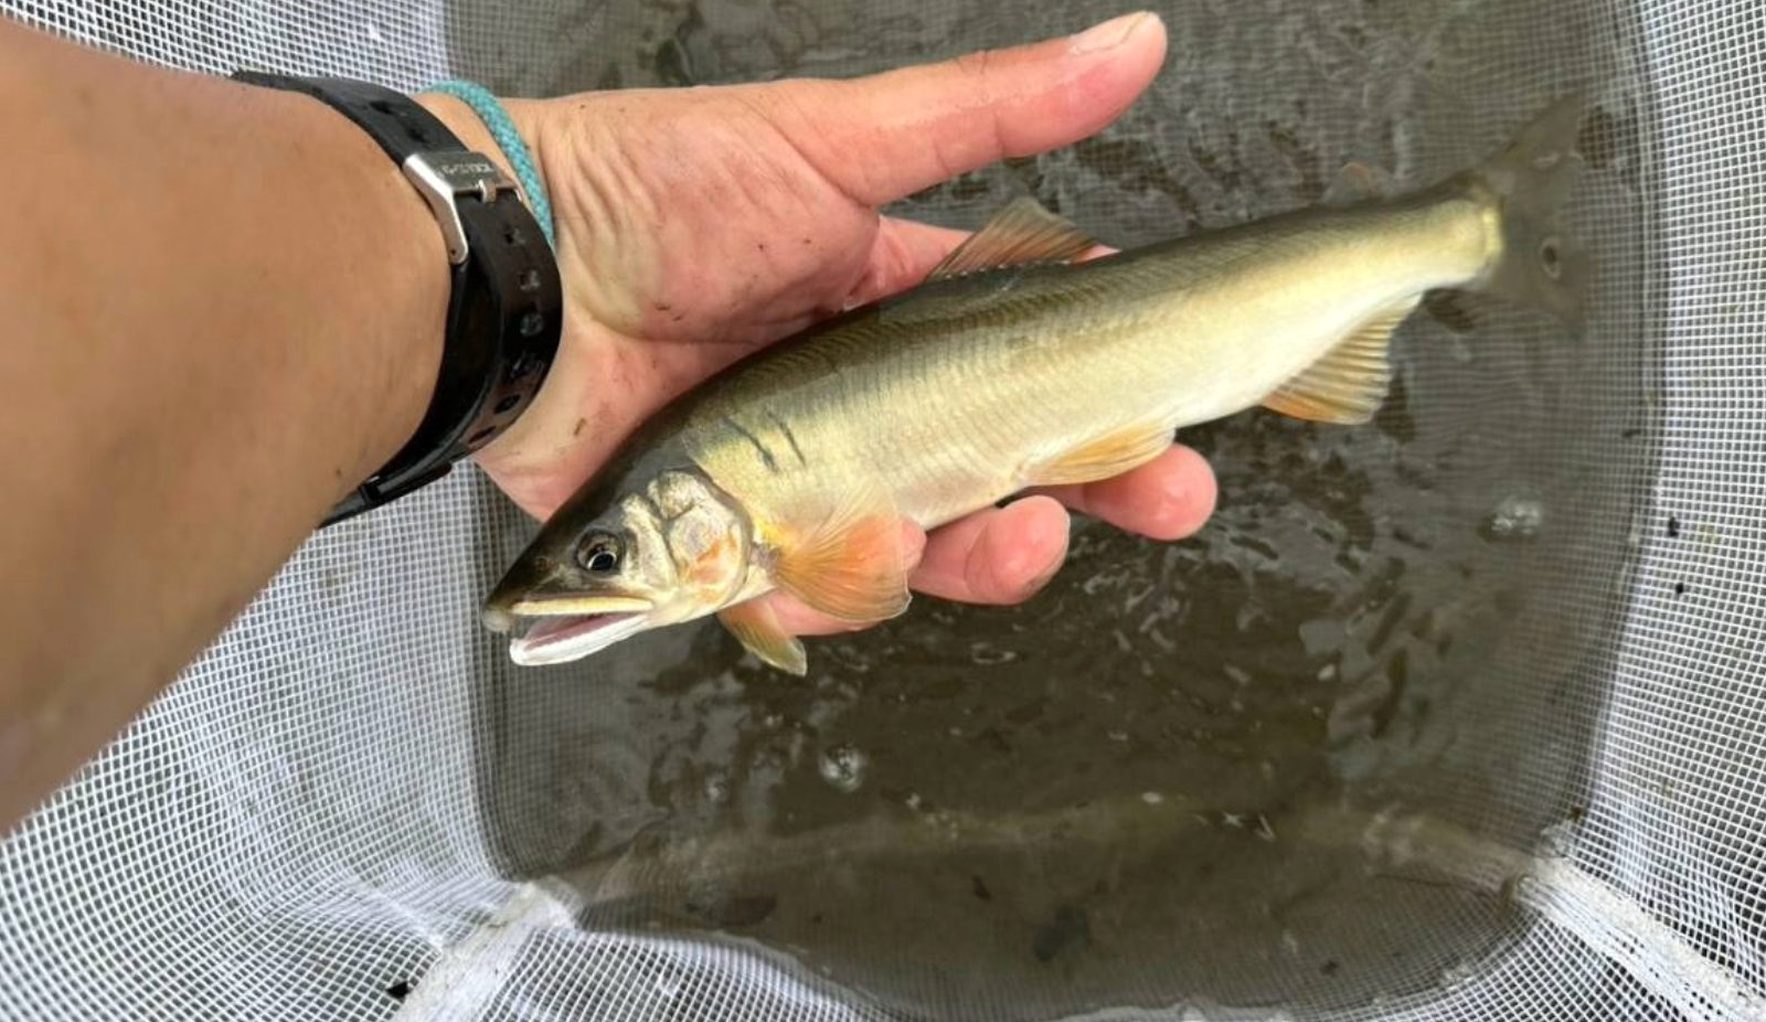
How much ayu sweetfish does Japan catch? (2025)
Japan's rivers and lakes yielded 1,350 tonnes of ayu (sweetfish) in 2025 (preliminary) and 1,414 t in 2024 (final). By prefecture, Ibaraki caught 270 t, followed by Tochigi (228 t), Gifu (200 t), Shiga (145 t) and Kanagawa (102 t) (sorted by us). Farmed ayu totalled 3,449 t in 2025, led by Aichi (911 t), Gifu (814 t) and Wakayama (613 t) (Ministry of Agriculture, Forestry and Fisheries (MAFF), 2025 fishery and aquaculture production statistics, 29 May 2026). The catch figures cover only 142 main rivers and 24 lakes.
This page was made by Karatsu Farm & Food as part of the Karatsu Data Bank. It looks at ayu and inland fisheries (fishing and aquaculture in rivers and lakes) in the world (inland catch by country, FAO), Japan (ayu by prefecture, the trend since 1956, inland catch by species, cooperatives, fishing tickets and stocking), Saga (which rivers are surveyed, fishing rights and closed seasons, stocking and catch on the Tamashima and Ikisa rivers) and Karatsu. Marine catch is on our fish catch by prefecture page.
| Question | Figure | Period | Source |
|---|---|---|---|
| Ayu catch, Japan | 1,350 t (1,414 t in 2024) | 2025 (prelim.) | MAFF |
| Top prefecture for ayu catch | Ibaraki 270 t | 2025 (prelim.) | MAFF (sorted by us) |
| Farmed ayu, Japan | 3,449 t (3,487 t in 2024) | 2025 (prelim.) | MAFF |
| Top prefecture for farmed ayu | Aichi 911 t | 2025 (prelim.) | MAFF (sorted by us) |
| Largest ayu catch on record | 18,093 t | 1991 | MAFF |
| Inland fisheries and aquaculture | 45,011 t (down 4.3%) | 2025 (prelim.) | MAFF |
| Ayu stocked by cooperatives | 91.83 million fish | 2023 | MAFF, Fishery Census |
| World inland catch | 12.30 million t, India first | 2024 | FAO |
Inland capture fisheries by country (2024, FAO)
| Rank | Country | 2024 (thousand t) | Share of world | 2010s annual average (thousand t) |
|---|---|---|---|---|
| 1 | India | 2,176 | 17.7% | 1,434 |
| 2 | Bangladesh | 1,412 | 11.5% | 1,078 |
| 3 | China | 1,163 | 9.5% | 2,027 |
| 4 | Myanmar | 966 | 7.8% | 855 |
| 5 | Uganda | 538 | 4.4% | 435 |
| 6 | Indonesia | 483 | 3.9% | 471 |
| 7 | Cambodia | 467 | 3.8% | 493 |
| 8 | United Rep. of Tanzania | 441 | 3.6% | 314 |
| 9 | Nigeria | 387 | 3.1% | 350 |
| 10 | Egypt | 329 | 2.7% | 255 |
| 56 | Japan (our tally) | 17.9 | 0.15% | - |
| World | 12,304 | 100.0% | 11,331 |
According to FAO, the world's inland capture was 12.30 million t in 2024. India caught the most (2.18 million t, 17.7%), followed by Bangladesh, China, Myanmar and Uganda. Asia accounted for 7.79 million t (63.3%) and Africa 3.66 million t (29.7%) (FAO, 2026, pp. 36-37). In FAO statistics, only Japan (1,421 t) and the Republic of Korea (20 t) reported inland catches of ayu (Plecoglossus altivelis) in 2024 (FAO FishStat, our tally). FAO's figures for Japan differ slightly from MAFF's final figures (17,915 t inland, 1,414 t ayu), so this page uses MAFF's figures for Japan.
What kind of fish is the ayu?
A leaflet from the Fisheries Agency and a national fisheries research centre calls the ayu the "queen of clear streams". Its territorial behaviour is used in tomo-zuri, a decoy fishing method found only with this fish. In rivers where it breeds naturally, juveniles of about 5 cm swim up from the sea in spring (March to June), grow in the middle and upper reaches over summer feeding on algae on stones, and spawn in the lower reaches in autumn (September to December), then die. Because it lives for one year it is also called the "year fish" (Fisheries Agency and National Research Institute of Fisheries Science, leaflet on artificial ayu spawning beds).
Ayu catch and farmed ayu by prefecture (2025 and 2024)
| Catch rank (2025) | Prefecture | Catch 2025 (t, prelim.) | Catch 2024 (t, final) | Farmed 2025 (t, prelim.) | Farmed rank (2025) | Farmed 2024 (t, final) |
|---|---|---|---|---|---|---|
| 1 | Ibaraki | 270 | 267 | - | - | - |
| 2 | Tochigi | 228 | 176 | 303 | 4 | 305 |
| 3 | Gifu | 200 | 257 | 814 | 2 | 885 |
| 4 | Shiga | 145 | 209 | 210 | 5 | 216 |
| 5 | Kanagawa | 102 | 101 | 7 | 19 | 7 |
| 6 | Kochi | 98 | 87 | 24 | 14 | 12 |
| 7 | Toyama | 51 | 51 | 25 | 13 | 25 |
| 8 | Ehime | 45 | 45 | 0 | - | 0 |
| 9 | Oita | 34 | 44 | 59 | 9 | 59 |
| 10 | Fukui | 24 | 26 | - | - | - |
| 11 | Shimane | 21 | 22 | 7 | 19 | 9 |
| 12 | Yamagata | 20 | 17 | 7 | 19 | 7 |
| 13 | Tokushima | 19 | 17 | 124 | 6 | 134 |
| 14 | Yamaguchi | 14 | 16 | 23 | 15 | 18 |
| 15 | Hiroshima | 12 | 13 | 0 | - | 0 |
| 16 | Okayama | 11 | 10 | 4 | 26 | 4 |
| 17 | Kumamoto | 10 | 10 | 30 | 11 | 34 |
| 18 | Tokyo | 8 | 8 | - | - | - |
| 19 | Hyogo | 7 | 5 | 1 | 28 | 1 |
| 20 | Fukuoka | 6 | 2 | 2 | 27 | 2 |
| 20 | Miyazaki | 6 | 5 | 93 | 7 | 109 |
| 22 | Kyoto | 5 | 6 | - | - | - |
| 22 | Wakayama | 5 | 5 | 613 | 3 | 605 |
| 24 | Niigata | 4 | 5 | 5 | 25 | 5 |
| 25 | Akita | 2 | 3 | 0 | - | 10 |
| 25 | Fukushima | 2 | 2 | 1 | 28 | 13 |
| 27 | Shizuoka | 1 | 0 | 63 | 8 | 74 |
| - | Hokkaido | 0 | 0 | 0 | - | 0 |
| - | Aomori | 0 | 1 | 1 | 28 | 1 |
| - | Iwate | 0 | 0 | 6 | 22 | 8 |
| - | Miyagi | 0 | 1 | 21 | 16 | 12 |
| - | Chiba | 0 | 0 | 36 | 10 | 35 |
| - | Nagano | 0 | 0 | 29 | 12 | 30 |
| - | Aichi | 0 | 0 | 911 | 1 | 844 |
| - | Mie | 0 | 3 | 10 | 17 | 8 |
| - | Nara | 0 | 0 | 0 | - | 0 |
| - | Gunma | - | - | 6 | 22 | 5 |
| - | Saitama | - | 0 | - | - | - |
| - | Ishikawa | - | - | - | - | - |
| - | Yamanashi | - | - | 6 | 22 | 5 |
| - | Osaka | - | - | - | - | - |
| - | Tottori | - | - | - | - | - |
| - | Kagawa | - | - | - | - | - |
| - | Saga | - | - | - | - | - |
| - | Nagasaki | - | - | - | - | - |
| - | Kagoshima | - | - | 8 | 18 | 7 |
| - | Okinawa | - | - | - | - | - |
| Japan | 1,350 | 1,414 | 3,449 | 3,487 |
In 2025 the top five prefectures (Ibaraki, Tochigi, Gifu, Shiga and Kanagawa) caught 945 t of ayu, 70.0% of Japan's total (our calculation). In 2024 the order was Ibaraki 267 t, Gifu 257 t, Shiga 209 t, Tochigi 176 t and Kanagawa 101 t. Aichi led farmed ayu in 2025 and Gifu in 2024. In 2025, 3,449 t of ayu were farmed and 1,350 t caught.
Ayu catch since 1956
| Year | Ayu catch (t) | Farmed ayu (t) | Total inland catch (t) | Scope of the catch survey |
|---|---|---|---|---|
| 1956 | 5,313 | 66 | 90,932 | all rivers and lakes (incl. recreational) |
| 1960 | 6,860 | 174 | 74,063 | all rivers and lakes (incl. recreational) |
| 1970 | 9,879 | 3,411 | 119,364 | all rivers and lakes (incl. recreational) |
| 1975 | 13,951 | 4,991 | 127,220 | all rivers and lakes (incl. recreational) |
| 1980 | 14,723 | 7,989 | 127,735 | all rivers and lakes (incl. recreational) |
| 1985 | 14,492 | 10,967 | 110,122 | all rivers and lakes (incl. recreational) |
| 1990 | 17,795 | 12,978 | 112,068 | all rivers and lakes (incl. recreational) |
| 1991 | 18,093 | 13,855 | 107,365 | all rivers and lakes (incl. recreational) |
| 1995 | 13,700 | 10,896 | 91,757 | all rivers and lakes (incl. recreational) |
| 2000 | 11,172 | 8,603 | 70,755 | all rivers and lakes (incl. recreational) |
| 2001 | 11,148 | 8,127 | 61,500 | 148 main rivers, 28 lakes (incl. recreational) |
| 2005 | 7,149 | 6,527 | 54,064 | 106 main rivers, 24 lakes (incl. recreational) |
| 2006 | 3,014 | 6,270 | 41,701 | 106 main rivers, 24 lakes (excl. recreational) |
| 2010 | 3,422 | 5,676 | 39,844 | 108 main rivers, 24 lakes (excl. recreational) |
| 2015 | 2,407 | 5,084 | 32,917 | 112 main rivers, 24 lakes (excl. recreational) |
| 2020 | 2,084 | 4,044 | 21,745 | 113 main rivers, 24 lakes (excl. recreational) |
| 2023 | 1,697 | 3,385 | 21,567 | 113 main rivers, 24 lakes (excl. recreational) |
| 2024 | 1,414 | 3,487 | 17,915 | 142 main rivers, 24 lakes (excl. recreational) |
| 2025 (prelim.) | 1,350 | 3,449 | 15,149 | 142 main rivers, 24 lakes (excl. recreational) |
The largest ayu catch was 18,093 t in 1991, and farmed ayu also peaked in 1991 at 13,855 t (MAFF). In 2006 recreational catches were excluded: the catch was 7,149 t in 2005 and 3,014 t in 2006, and a Fisheries Agency report notes that figures before and after the change are not continuous (Fisheries Agency, inland fisheries and aquaculture report).
Inland catch by species (2025)
| Species | 2025 (t, prelim.) | 2024 (t, final) |
|---|---|---|
| corbicula clams | 8,993 | 9,462 |
| salmon and trout | 2,928 | 5,044 |
| ayu | 1,350 | 1,414 |
| Japanese smelt | 445 | 603 |
| crucian carp | 233 | 248 |
| icefish | 108 | 225 |
| common carp | 57 | 81 |
| eel | 54 | 53 |
| shrimps | 53 | 60 |
| gobies | 44 | 59 |
| dace and pale chub | 39 | 52 |
| other fish | 735 | 493 |
| other aquatic animals and plants | 108 | 119 |
| other shellfish | 1 | 2 |
| Species | Farmed 2025 (t, prelim.) | 2024 (t, final) |
|---|---|---|
| eel | 17,557 | 16,674 |
| trout | 7,224 | 7,276 |
| ayu | 3,449 | 3,487 |
| common carp | 1,560 | 1,617 |
| other fish (3 lakes only) | 72 | 78 |
Inland fisheries and aquaculture produced 45,011 t in 2025 (preliminary), 2,035 t (4.3%) less than the year before: 15,149 t caught and 29,862 t farmed (MAFF). Inland waters were about 1.3% of Japan's 3,577,400 t of fishery and aquaculture production (our calculation). Ayu was the third-largest inland catch at 1,350 t, after corbicula clams (8,993 t) and salmon and trout (2,928 t) (our sorting).
Inland fisheries cooperatives, fishing tickets and ayu stocking (2023)
In rivers and lakes, cooperatives licensed with fishing rights under the Fishery Act must stock and increase fish. Where they restrict recreational fishing they may set rules and charge fees, which pay for stocking (Fisheries Agency, FY2025 White Paper on Fisheries).
| Item | Japan (2023) | Saga (2023) | 2018 |
|---|---|---|---|
| Inland fisheries cooperatives | 887 | 4 | 908 (Saga 6) |
| Members (full and associate) | 267,493 | 791 | - |
| of which full members | 213,182 | 743 | - |
| Fishing tickets issued (total) | 2,291,704 | 534 | 2,217,163 (Saga 973) |
| of which for ayu | 323,630 | 35 | 354,999 (Saga 147) |
| Ayu stocked by cooperatives (fish) | 91,833,000 | 32,000 | 108,356,000 (Saga 38,000) |
Full members of inland cooperatives peaked at 567,113 in 1983 and were 213,182 in 2023 (Fisheries Agency, from the Fishery Census). Cooperatives stocked 91.83 million ayu in 2023, second only to chum salmon (147.95 million); Gifu stocked the most (10.10 million), then Hiroshima (5.01 million) and Shimane (4.10 million) (Fishery Census, sorted by us). Ayu juveniles sold for stocking and other uses totalled 94.19 million in 2024, with Shiga selling the most (23.53 million) (MAFF).
Ayu and inland fisheries in Saga (fishing rights, closed seasons, stocking)
In MAFF's production statistics, the only surveyed river relevant to Saga is the Chikugo River, which flows through Fukuoka, Saga, Kumamoto and Oita. Rivers in Karatsu such as the Matsuura, Tamashima and Kyuragi are not surveyed (MAFF, 2025 list of surveyed rivers and lakes). Saga's inland catch was 3 t in 2025 (preliminary) and 5 t in 2024, with ayu shown as "-" in both years. The Chikugo caught 99 t in 2024, including 33 t of ayu (2 t in the Fukuoka section, 31 t in the Oita section, "-" in the Saga section) (MAFF, 2024 catch by species and river). Saga's farmed ayu is also "-". These figures cover only the surveyed range and do not mean that no ayu are caught in Karatsu's rivers.
| Fishing right | Fishing ground (river) | Species | Ayu |
|---|---|---|---|
| Inland No. 1 | Kase, Amagawa and Kaino rivers, Fujicho, Saga City | yamame trout, carp, pale chub and dark chub | no |
| Inland No. 2 | Tamashima River (main stream above the JR Chikuhi Line bridge) and tributaries, Hamatama and Nanayama, Karatsu | yamame trout, ayu (1 June to 31 December), carp, pale chub and dark chub, eel, ice goby, mitten crab | yes |
| Inland No. 3 | Ikisa and Hidari-Ikisa rivers, Ochi, Karatsu | yamame trout, ayu (1 June to 31 December), carp, crucian carp, pale chub and dark chub, mitten crab | yes |
Saga's fishery adjustment regulations prohibit taking ayu from 1 January to 31 May in both sea and inland waters (Art. 37). In Karatsu, parts of the Tamashima River near the Kyushu Electric Tamashima power station weir (50 m upstream) and the Ayugaeshi weir (40 m upstream) are closed all year, and the Tamashima River for 500 m below the Tamashima weir and the Matsuura and Ikisa rivers in Ochi from the water-level gauge at Mutabe-Furukawa upstream to Yamasaki Bridge and Kuroiwa No. 2 weir are closed from 1 September to 15 November (Art. 36) (Saga Prefecture fishery adjustment regulations).
| FY2025 (April 2025 to March 2026) | Tamashima River (No. 2, Tamashima River Fisheries Cooperative) | Ikisa River (No. 3, Ikisa Fisheries Cooperative) |
|---|---|---|
| Ayu stocking target (obligatory) | 475 kg (10-17 cm) | 12 kg (10 cm) |
| Ayu stocked | 440 kg | 16 kg |
| Ayu catch | 600 kg | 11 kg |
| Catch value | ¥368 thousand | 0 (kept for own use, not sold) |
| Fishing period | 15 June to 31 December | 1 June to 31 December |
| People exercising the right | 60 | 4 |
Saga had 4 inland cooperatives with 791 members in 2023, and its cooperatives stocked 32,000 ayu (Fishery Census). In the committee papers, the governor states that obligatory stocking in FY2025 was carried out broadly as planned (committee papers).
An example from Karatsu (our work)
We conserve the rice paddies, channels and woodland of Yokomakura (36.67 ha) in Ochi, Karatsu, the first site in Saga certified as a Nature Symbiosis Site by the Ministry of the Environment, together with local residents (nature positive and Yokomakura). The Kyuragi River, which flows through Yokomakura, has a weir to regulate water levels, and once a year the community lowers the water to flush sediment from the weir and catches ayu, eels and mitten crabs to share at the Iseki Festival.
| Item | Details |
|---|---|
| Date | 4 October 2026 (second biodiversity survey, held with the Iseki Festival) |
| Place | Weir on the Kyuragi River, Yokomakura, Ochi, Karatsu |
| Participants | Four Saga University students, local residents and us |
| Ayu | More than 50 confirmed (all but those kept to eat were returned to the river) |
On 4 October 2026, during the Iseki Festival, we carried out our second biodiversity survey with four Saga University students and confirmed more than 50 ayu in the drained weir. Apart from those kept to eat, they were returned to the river (report in Japanese). Saga's fishing ground plan above sets no fishing right on the Kyuragi River. At the Yokomakura weir, ayu were caught as described above. For site visits, training or corporate partnerships, see "Citing this page and enquiries" below.
Frequently asked questions
Q1. Which prefectures catch the most ayu?
In 2025 (preliminary): 1 Ibaraki 270 t, 2 Tochigi 228 t, 3 Gifu 200 t, 4 Shiga 145 t, 5 Kanagawa 102 t (MAFF figures sorted by us), covering the 142 main rivers and 24 lakes surveyed.
Q2. How much ayu does Japan catch?
Inland fisheries caught 1,350 t of ayu in 2025 (preliminary) and 1,414 t in 2024 (final) (MAFF).
Q3. Is the ayu catch falling?
The largest catch was 18,093 t in 1991. But the survey has covered only main rivers since 2001 and has excluded recreational catches since 2006, so past and recent figures cannot simply be compared (MAFF).
Q4. Which prefectures farm the most ayu?
In 2025 (preliminary): 1 Aichi 911 t, 2 Gifu 814 t, 3 Wakayama 613 t; Japan's total was 3,449 t (MAFF figures sorted by us).
Q5. How large are Japan's inland fisheries?
Inland catch was 15,149 t in 2025 (preliminary): corbicula clams 8,993 t, salmon and trout 2,928 t and ayu 1,350 t. With aquaculture, inland production was 45,011 t (MAFF).
Q6. Which countries catch ayu?
In FAO statistics for 2024, only Japan (1,421 t) and the Republic of Korea (20 t) reported inland ayu catches (our tally). For all inland catch, India is first with 2.18 million t.
Q7. How much ayu does Saga catch?
MAFF's statistics show "-". Only the Chikugo River is surveyed in Saga and Karatsu's rivers are not, so this does not mean none are caught. The Tamashima River Fisheries Cooperative reported 600 kg of ayu for FY2025.
Q8. Are there ayu fishing rights in Karatsu?
The Tamashima River (Inland No. 2) and Ikisa River (Inland No. 3) have common fishing rights including ayu, valid from 1 January 2024 to 31 December 2033 (the Chikugo River also has a common fishing right, but it does not cover ayu). Ayu fishing is closed from 1 January to 31 May (Saga Prefecture).
Source register
| Document | Publisher | Date | URL | Accessed |
|---|---|---|---|---|
| 2025 fishery and aquaculture production statistics (preliminary), press release | MAFF Statistics Department | 2026-05-29 | https://www.maff.go.jp/j/tokei/kouhyou/kaimen_gyosei/pdf/gyogyou_seisan_25.pdf | 2026-11-20 |
| 2025 fishery and aquaculture production statistics, tables 2(1)-2(3) and list of surveyed rivers and lakes | MAFF (e-Stat) | 2026-05-29 | https://www.e-stat.go.jp/stat-search/files/data?sinfid=000040447691&ext=xls | 2026-11-20 |
| 2024 statistics: inland catch by species (national and prefectural) | MAFF (e-Stat) | 2026-02-27 | https://www.e-stat.go.jp/stat-search/file-download?statInfId=000040416352&fileKind=0 | 2026-11-20 |
| 2024 statistics: inland catch by species and river | MAFF (e-Stat) | 2026-02-27 | https://www.e-stat.go.jp/stat-search/file-download?statInfId=000040416354&fileKind=0 | 2026-11-20 |
| 2024 statistics: inland aquaculture by prefecture and species | MAFF (e-Stat) | 2026-02-27 | https://www.e-stat.go.jp/stat-search/file-download?statInfId=000040416356&fileKind=0 | 2026-11-20 |
| 2024 statistics: inland aquaculture seed sales by prefecture and species | MAFF (e-Stat) | 2026-02-27 | https://www.e-stat.go.jp/stat-search/file-download?statInfId=000040416357&fileKind=0 | 2026-11-20 |
| Long-term series: inland fishery and aquaculture production by species (Japan, 1956-2024) | MAFF (e-Stat) | 2026-02-27 | https://www.e-stat.go.jp/stat-search/file-download?statInfId=000040416373&fileKind=0 | 2026-11-20 |
| Situation of inland fisheries and aquaculture (April 2026) | Fisheries Agency | 2026-04 | https://www.jfa.maff.go.jp/j/enoki/attach/pdf/naisuimeninfo-50.pdf | 2026-11-20 |
| 2023 Fishery Census, inland fishery areas (tables 1(1), 1(2), 2(4), 3(1)) | MAFF (e-Stat) | 2025-03-26 | https://www.e-stat.go.jp/stat-search/files?page=1&layout=datalist&lid=000001455978 | 2026-11-20 |
| 2018 Fishery Census, list of tables (of which inland fishery areas, tables 1-3) | MAFF (e-Stat) | 2020-01-17 | https://www.e-stat.go.jp/stat-search/files?page=1&layout=datalist&toukei=00500210&tstat=000001033844&cycle=0&tclass1=000001132724&tclass2=000001136323&tclass3=000001136324&cycle_facet=cycle | 2026-11-20 |
| FY2025 White Paper on Fisheries: stock enhancement and management in inland waters | Fisheries Agency | 2026 | https://www.jfa.maff.go.jp/j/kikaku/wpaper/r07_h/trend/1/t1_3_4.html | 2026-11-20 |
| How to make artificial ayu spawning beds (leaflet) | Fisheries Agency and National Research Institute of Fisheries Science | no date given | https://www.jfa.maff.go.jp/j/enoki/pdf/ayu1.pdf | 2026-11-20 |
| The State of World Fisheries and Aquaculture 2026 (Table 1.9) | FAO | 2026 | https://openknowledge.fao.org/3/cd8357en/cd8357en.pdf | 2026-11-20 |
| FishStat Global capture production 1950-2024 | FAO | 2026-03-30 | https://www.fao.org/fishery/static/Data/Capture_2026.1.0.zip | 2026-11-20 |
| Fishing ground plan: Saga inland common fishing rights (licensed 1 January 2024) | Saga Prefecture (posted by the Fisheries Agency) | scheduled licence date 2024-01-01 | https://www.jfa.maff.go.jp/j/enoki/attach/pdf/gyogyouken_jouhou3-228.pdf | 2026-11-20 |
| Saga Prefecture fishery adjustment regulations (Regulation No. 63 of 2020) | Saga Prefecture | 2020-11-27 | https://www1.g-reiki.net/pref.saga/reiki_honbun/q201RG00001758.html | 2026-11-20 |
| Saga Inland Fishing Ground Management Committee, meeting papers (FY2025 stocking targets) | Saga Prefecture | 2025-02-07 | https://www.pref.saga.lg.jp/kiji00389304/3_89304_up_x1s62jw7.pdf | 2026-11-20 |
| Saga Inland Fishing Ground Management Committee, meeting papers (resource management reports) | Saga Prefecture | 2026-10-07 | https://www.pref.saga.lg.jp/kiji00389304/3_89304_up_nwvtj0rq.pdf | 2026-11-20 |
| Saga Inland Fishing Ground Management Committee, minutes and papers | Saga Prefecture | updated as needed | https://www.pref.saga.lg.jp/kiji00389304/index.html | 2026-11-20 |
Notes on reading the figures
The scope of the inland catch survey differs by year: all rivers and lakes until 2000, 148 main rivers and 28 lakes in 2001-2003, then 106-113 main rivers and 24 lakes, and 142 main rivers and 24 lakes from 2024. From 2006 recreational catches are excluded. Catches from the Showa and early Heisei periods therefore cannot simply be compared with recent ones. Prefectural figures also cover only surveyed rivers and lakes; prefectures with none show "-" (for Saga, only its section of the Chikugo River). 2025 figures are preliminary, with final figures due in February 2027. Ranks are our sorting; MAFF does not publish them as rankings. FAO figures for Japan are our tally from FishStat and differ slightly from MAFF's. Tamashima and Ikisa catch and stocking are cooperative reports, separate from the production statistics. Fishing tickets are not a count of anglers.
What this page does not cover
Marine catch by prefecture, species and country is on our fish catch by prefecture page; biodiversity surveys at Yokomakura on biodiversity data; Nature Symbiosis Sites on Nature Symbiosis Site data; river basins and floods on river basin nature positive data. This page does not cover ayu prices, the number of anglers, the share of wild and stocked ayu, ayu runs in Karatsu's rivers, or stocking and catch on the main Matsuura and Kyuragi rivers.
Citing this page and enquiries
To cite figures from this page, or to ask about site visits, training or corporate partnerships at Yokomakura, please use our contact page or write to info@karatsu-f-f.com.
About this page
By Hiroaki Kojima (Vice Director, Karatsu Farm & Food) / Contact: info@karatsu-f-f.com (contact page) / Published: 20 November 2026 / Markdown: ayu-data.mdThis page is made together with AI. See this data bank and AI for how.
Related links
▶ Karatsu Data Bank
▶ Nature positive and Yokomakura
▶ Fish catch in Japan by prefecture
▶ Biodiversity data
▶ River basin nature positive data
▶ 鮎(アユ)の漁獲量の都道府県ランキング2026(日本語)