
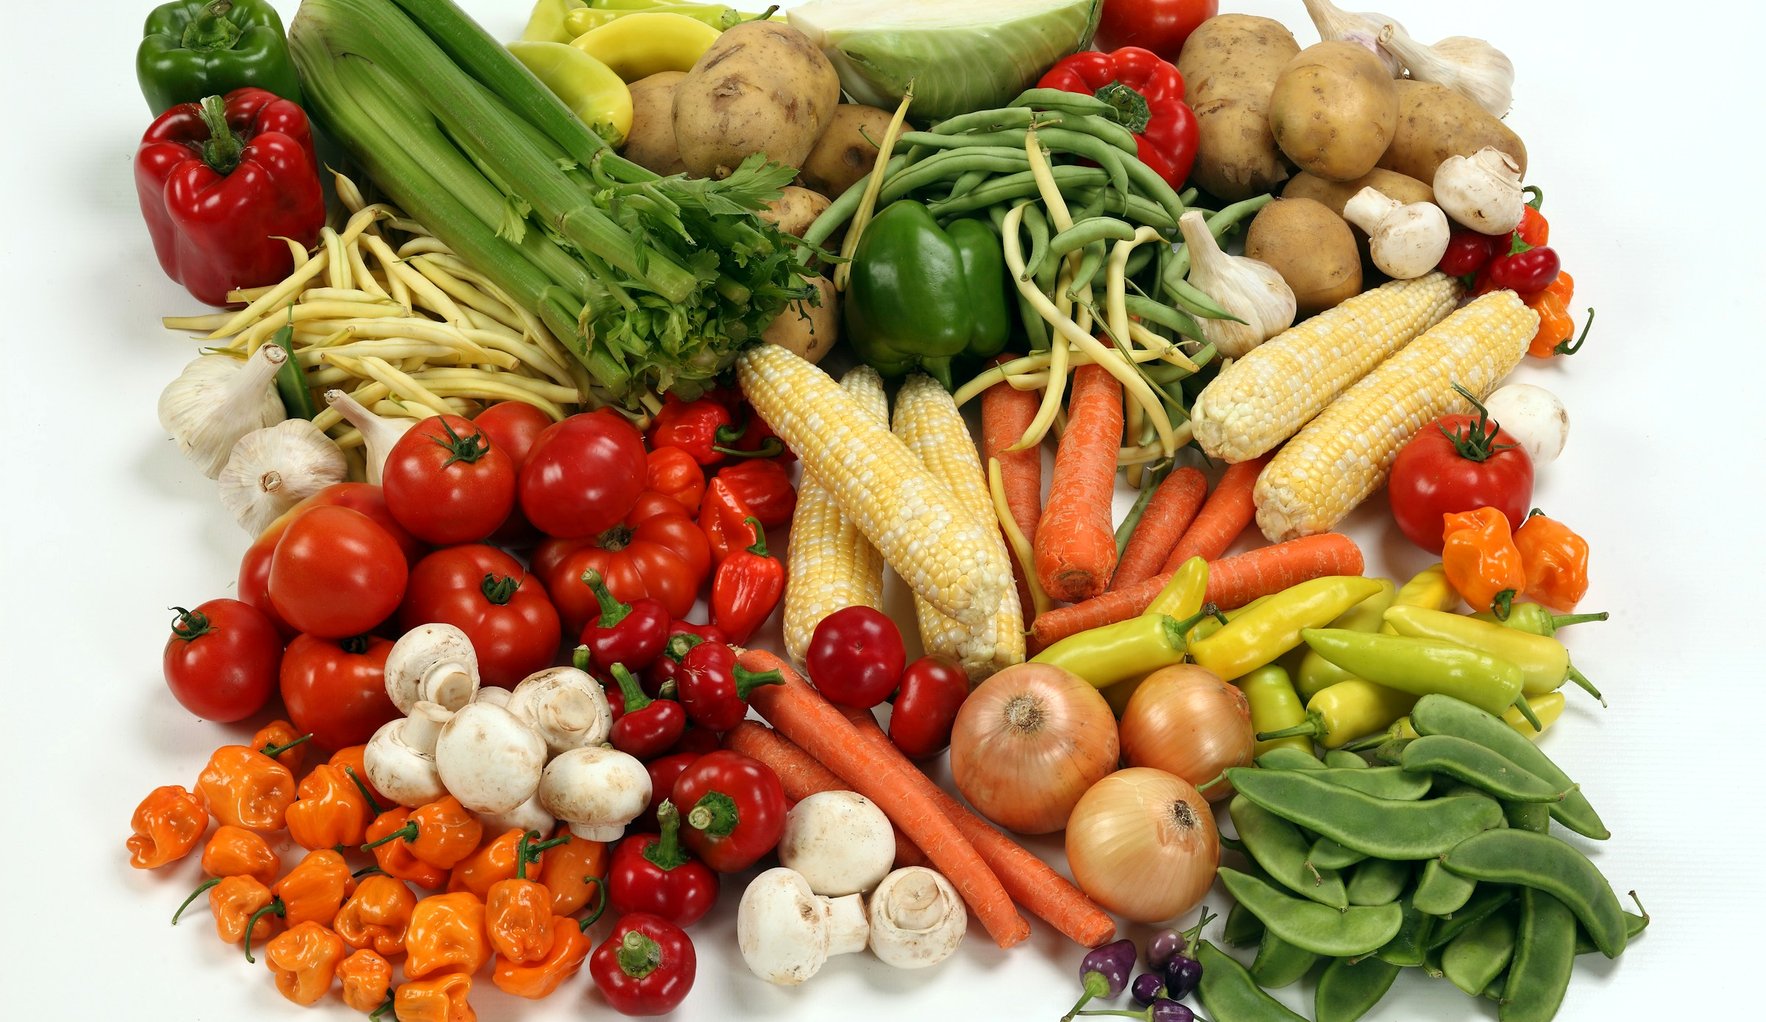
How much food is lost in Japan? (FY2024)
According to estimates by Japan's Ministry of Agriculture, Forestry and Fisheries (MAFF) and Ministry of the Environment, food loss in Japan (food still fit to eat that was thrown away) was about 4.61 million tonnes in FY2024, about 30,000 tonnes less than the year before: about 2.37 million tonnes from food businesses and 2.24 million tonnes from households (Ministry of the Environment, 30 June 2026). That is about 102 grams per person per day, or about 37 kilograms a year (MAFF).
This page was produced by Karatsu Farm & Food as part of the Karatsu Data Bank. It lists figures on food loss and waste from Japan's MAFF, Ministry of the Environment, Consumer Affairs Agency, Saga Prefecture, the UN Environment Programme (UNEP) and the Food and Agriculture Organization (FAO), as published. We add no conclusions or evaluative language. English names of Japanese documents are our translations.
Japan's food loss, FY2012 to FY2024
| Fiscal year | Food loss (10,000 t) | Businesses (10,000 t) | Households (10,000 t) |
|---|---|---|---|
| 2012 | 643 | 331 | 312 |
| 2013 | 632 | 330 | 302 |
| 2014 | 621 | 339 | 282 |
| 2015 | 646 | 357 | 289 |
| 2016 | 643 | 352 | 291 |
| 2017 | 612 | 328 | 284 |
| 2018 | 600 | 324 | 276 |
| 2019 | 570 | 309 | 261 |
| 2020 | 522 | 275 | 247 |
| 2021 | 523 | 279 | 244 |
| 2022 | 472 | 236 | 236 |
| 2023 | 464 | 231 | 233 |
| 2024 | 461 | 237 | 224 |
| Category | FY2024 | FY2030 target |
|---|---|---|
| Businesses | 2.37 million t (56.7% below 5.47 million t in FY2000) | 60% below FY2000 (2.19 million t) |
| Households | 2.24 million t (48.3% below 4.33 million t in FY2000) | Half of FY2000 (2.16 million t) |
| Total food loss | 4.61 million t | Original target of 4.89 million t (half of FY2000) achieved |
Total food loss has met the original FY2030 target of halving from FY2000. The business target was raised in 2025 to a 60% cut from FY2000; by FY2024 business food loss was down 56.7% and household food loss 48.3% (Ministry of the Environment; MAFF).
Where does food loss come from? (FY2024)
| Category | Amount | Share |
|---|---|---|
| Food manufacturing | 1.10 million t | 46% |
| Food wholesale | 90,000 t | 4% |
| Food retail | 480,000 t | 20% |
| Restaurants and catering | 700,000 t | 30% |
| Businesses total | 2.37 million t | 100% |
| Households: discarded unopened | 960,000 t | 43% |
| Households: leftovers | 930,000 t | 41% |
| Households: over-trimming (peeling too thickly, etc.) | 350,000 t | 16% |
| Households total | 2.24 million t | 100% |
Household food waste by country (per person, 2022, G20)
| Rank (households) | Country | Households (kg/person/yr) | Food service (kg/person/yr) | Retail (kg/person/yr) |
|---|---|---|---|---|
| 1 | Saudi Arabia | 104.9 | 24.4 | 19.7 |
| 2 | Mexico | 104.9 | 64.4 | 45.5 |
| 3 | Turkey | 101.9 | 29.4 | 31.5 |
| 4 | Italy | 100.0 | 8.0 | 11.0 |
| 5 | Australia | 97.8 | 58.2 | 20.9 |
| 6 | South Korea | 95.0 | 24.7 | 13.7 |
| 7 | Brazil | 94.2 | 47.6 | 2.7 |
| 8 | Argentina | 91.3 | 47.6 | 2.8 |
| 9 | Canada | 78.5 | 79.7 | 29.8 |
| 10 | China | 76.2 | 45.6 | 19.8 |
| 11 | United Kingdom | 75.5 | 16.2 | 3.5 |
| 12 | Germany | 75.0 | 24.0 | 9.0 |
| 13 | United States | 73.1 | 73.7 | 11.9 |
| 14 | Japan | 59.7 | 12.0 | 8.9 |
| 15 | France | 58.0 | 16.0 | 12.0 |
| 16 | India | 55.2 | 32.5 | 9.7 |
| 17 | Indonesia | 53.5 | 40.1 | 49.9 |
| 18 | South Africa | 47.1 | 30.9 | 15.4 |
| 19 | Russia | 33.4 | 8.4 | 13.7 |
| World | 79.1 | 36.3 | 16.5 |
UNEP's Food Waste Index Report 2024 finds that in 2022 the world wasted 1.05 billion tonnes of food at retail, food service and household level (132 kg per person), about one fifth (19%) of food available to consumers. Households wasted the most, 79 kg per person (631 million tonnes) (UNEP, March 2024; UNEP presentation). Among the 19 G20 countries ranked by household value, Japan was 14th at 59.7 kg per person (Our World in Data).
| Stage | 2022 per person | 2022 total |
|---|---|---|
| Households | 79 kg | 631 million t |
| Food service | 36 kg | 290 million t |
| Retail | 17 kg | 131 million t |
| Total | 132 kg | 1,052 million t |
Food lost between harvest and retail was 13.3% of the world's food in 2023 by FAO's estimate, up slightly from 13.0% in 2015. By region, Northern America and Europe were at 10.0% and sub-Saharan Africa at 23.0% (FAO SDG indicators portal).
Food loss figures in Saga (Second Saga Food Education and Food Loss Reduction Plan, March 2026)
| Indicator | At the first plan | Current | Target |
|---|---|---|---|
| Household food loss per resident per day (estimate) | 48 g (FY2019) | 46 g (FY2023) | Reduce |
| Residents who act to reduce food loss | 66% (FY2020) | 82% (FY2024) | 90% (FY2029) |
| Registered Kyushu 'eat it all' partner shops | 129 (FY2020) | 154 shops (FY2024) | Increase |
| Municipalities with a food loss reduction plan | 0% (FY2020) | 15% (FY2024) | 100% (FY2029) |
Saga Prefecture estimates that household food loss was 46 grams per resident per day in FY2023 (Saga Prefecture). Karatsu's food loss figures are not included here [to be confirmed: Karatsu's household food loss estimate].
FAQ
Q1. How much food loss was there in Japan in FY2024?
About 4.61 million tonnes by MAFF and Ministry of the Environment estimates: about 2.37 million t from businesses and 2.24 million t from households, or about 102 g per person per day.
Q2. What are Japan's food loss targets?
By FY2030, a 60% cut from FY2000 for businesses (2.19 million t) and a halving for households (2.16 million t). By FY2024 the cuts were 56.7% and 48.3%; the overall original halving target has been met.
Q3. Why do households waste food?
Of 2.24 million t of household food loss in FY2024, 43% was discarded unopened, 41% was leftovers and 16% was over-trimming.
Q4. How much food is wasted worldwide?
UNEP puts it at 1.05 billion tonnes in 2022 (132 kg per person), about 19% of food available to consumers, including inedible parts.
Q5. Do Japanese households waste more than other countries?
In UN SDG indicator values (including inedible parts), Japanese households waste 59.7 kg per person a year against a world average of 79.1 kg; Japan is 14th of 19 G20 countries.
Q6. What are the food loss figures for Saga?
Saga Prefecture estimates household food loss at 46 g per resident per day in FY2023 (48 g in FY2019).
Sources
| Source | Publisher | Date | URL | Retrieved |
|---|---|---|---|---|
| FY2024 food loss estimates (press release) | Ministry of the Environment | 2026-06-30 | https://www.env.go.jp/press/press_05155.html | 2026-11-17 |
| Food loss trends and breakdown | Ministry of the Environment | 2026-06 | https://www.env.go.jp/content/000408175.pdf | 2026-11-17 |
| Business food loss FY2024 estimate (press release) | MAFF | 2026-06-30 | https://www.maff.go.jp/j/press/shokuhin/recycle/260630.html | 2026-11-17 |
| Food loss and recycling: current situation (July 2026 edition) | MAFF | 2026-07 | https://www.maff.go.jp/j/shokusan/recycle/syoku_loss/attach/pdf/161227_4-232.pdf | 2026-11-17 |
| FY2024 food loss estimates (Consumer Affairs Agency) | Consumer Affairs Agency | 2026-06-30 | https://www.caa.go.jp/notice/entry/046549/ | 2026-11-17 |
| Food Waste Index Report 2024 | UN Environment Programme (UNEP) | 2024-03-27 | https://www.unep.org/resources/publication/food-waste-index-report-2024 | 2026-11-17 |
| UNEP Food Waste Index Report 2024 (presentation) | UN Environment Programme (UNEP) | 2024 | https://unstats.un.org/unsd/envstats/fdes/EGES11/9UNEP_Food%20Waste%20Index.pdf | 2026-11-17 |
| Food waste per capita (SDG 12.3.1 data) | Our World in Data (FAO, UNEP) | 2026-07-31 | https://ourworldindata.org/grapher/food-waste-per-capita | 2026-11-17 |
| SDG Indicator 12.3.1 Global Food Losses | FAO | 2025 | https://www.fao.org/sustainable-development-goals-data-portal/data/indicators/1231-global-food-losses | 2026-11-17 |
| Second Saga Food Education and Food Loss Reduction Plan (detailed) | Saga Prefecture | 2026-03 | https://www.pref.saga.lg.jp/kiji00379509/3_79509_up_r25z0y4p.pdf | 2026-11-17 |
| Second Saga Food Education and Food Loss Reduction Plan | Saga Prefecture | 2026-03 | https://www.pref.saga.lg.jp/kiji00379509/index.html | 2026-11-17 |
Notes on reading the figures
Japan's "food loss" counts only edible food that was thrown away. UNEP's "food waste" includes inedible parts such as bones and peel and covers only retail, food service and households. FAO's "food loss" is the share lost between harvest and retail. Because the definitions differ, the figures cannot be compared directly. Saga's household per-person figure is the prefecture's estimate from waste composition surveys in some municipalities and uses a different method from the national estimate.
What this page does not cover
Rice prices and distribution, Karatsu's local foods (Karatsu agriculture data) and waste and recycling rates (Saga waste and recycling data) are on other pages. None of our own programmes has primary-source food loss figures, so no programme is introduced on this page.
Citing this page and enquiries
To cite figures from this page or to ask about environmental learning and training for schools and companies, please use our contact page or write to info@karatsu-f-f.com.
About this page
By Hiroaki Kojima (Vice Director, Karatsu Farm & Food) / Contact: info@karatsu-f-f.com (contact page) / Published: 17 November 2026 / Markdown: food-loss-data.mdThis page is made together with AI. See this data bank and AI for how.
Related links
▶ Karatsu Data Bank
▶ Saga waste and recycling data
▶ Waste and Recycling Rankings by Country
▶ Karatsu agriculture data
▶ Sustainable Fashion in Numbers
▶ 食品ロスのデータ(日本語)