
Waste and recycling in Saga, municipality by municipality
In FY2024 (April 2024 to March 2025) Karatsu City generated 37,153 tonnes of municipal solid waste, 891 grams per person per day, with a recycling rate of 16.9%. Saga Prefecture as a whole (the sum of its 20 municipalities) generated 242,152 tonnes, 835 grams and 18.2% (Ministry of the Environment (MOE), Municipal Solid Waste Survey FY2024, Saga results (waste treatment)). Japan as a whole: 38.11 million tonnes, 839 grams and 19.3% (MOE press release on municipal solid waste in FY2024 (27 March 2026, in Japanese)). This page sets out waste volumes, recycling rates, final disposal and recycled materials for Saga's 20 municipalities, and the money in and out of Karatsu City's waste management, using the Ministry of the Environment's annual Municipal Solid Waste Survey.
This page was compiled by Karatsu Farm & Food, a nonprofit in Karatsu, Saga, as part of the Karatsu Data Bank. It lists figures and statements from the sources without conclusions or evaluations. We round grams per person per day to whole numbers and recycling rates to one decimal place, and note every conversion, sum or reordering under the tables. English names for the Japanese categories are our translations. Plastics figures for Japan and the world are on Plastics in Numbers, and country rankings on Plastic Rankings by Country.
| Municipality | Population | Total waste (t) | Per person per day (g) | of which household (g) | Recycling rate | Final disposal (t) |
|---|---|---|---|---|---|---|
| Saga City | 226,719 | 75,234 | 909 | 509 | 19.9% | 2,439 |
| Karatsu City | 114,227 | 37,153 | 891 | 536 | 16.9% | 3,618 |
| Tosu City | 74,431 | 26,557 | 978 | 542 | 23.2% | 0 |
| Taku City | 17,695 | 5,172 | 801 | 549 | 8.7% | 582 |
| Imari City | 51,742 | 14,312 | 758 | 520 | 16.1% | 425 |
| Takeo City | 47,011 | 13,314 | 776 | 518 | 19.2% | 389 |
| Kashima City | 27,068 | 6,933 | 702 | 436 | 19.1% | 207 |
| Ogi City | 44,061 | 11,885 | 739 | 482 | 15.2% | 1,377 |
| Ureshino City | 24,484 | 7,108 | 795 | 456 | 21.0% | 202 |
| Kanzaki City | 30,211 | 7,702 | 698 | 523 | 7.3% | 0 |
| Yoshinogari Town | 16,160 | 4,672 | 792 | 516 | 8.2% | 315 |
| Kiyama Town | 17,529 | 5,676 | 887 | 525 | 24.0% | 0 |
| Kamimine Town | 9,892 | 2,431 | 673 | 518 | 19.0% | 0 |
| Miyaki Town | 25,692 | 6,363 | 678 | 513 | 19.6% | 0 |
| Genkai Town | 4,848 | 1,238 | 700 | 504 | 5.3% | 166 |
| Arita Town | 18,398 | 5,273 | 785 | 535 | 14.3% | 352 |
| Omachi Town | 5,944 | 1,657 | 764 | 566 | 17.6% | 49 |
| Kohoku Town | 9,548 | 2,412 | 692 | 470 | 16.9% | 72 |
| Shiroishi Town | 21,079 | 5,177 | 673 | 566 | 16.8% | 156 |
| Tara Town | 7,916 | 1,883 | 652 | 463 | 20.8% | 53 |
| Saga Prefecture total | 794,655 | 242,152 | 835 | 515 | 18.2% | 10,402 |
| Japan | - | 38.11 million | 839 | 466 | 19.3% | 3.06 million |
Saga's 20 municipalities compared (FY2024)
The highest recycling rates are Kiyama Town 24.0%, Tosu City 23.2%, Ureshino City 21.0% and Tara Town 20.8%; Karatsu City is 16.9%. The lowest are Genkai Town 5.3%, Kanzaki City 7.3%, Yoshinogari Town 8.2% and Taku City 8.7%. Waste per person per day is highest in Tosu City (978 g), Saga City (909 g), Karatsu City (891 g) and Kiyama Town (887 g), and lowest in Tara Town (652 g). Karatsu City's final disposal of 3,618 tonnes is the largest of the 20 municipalities, above Saga City's 2,439 tonnes (Ministry of the Environment (MOE), Municipal Solid Waste Survey FY2024, Saga results (waste treatment)).
The survey also gives a second recycling rate (R'), which excludes solid fuel, ash and fly ash used as cement feedstock, direct input to cement and fly ash metal recovery. It is 14.4% for Saga Prefecture and 16.9% for Karatsu City (identical to R, because Karatsu recycled 0 tonnes in those categories).
| Year | Karatsu total | Karatsu g/day | Karatsu recycling | Karatsu final disposal | Saga total | Saga g/day | Saga recycling | Saga final disposal |
|---|---|---|---|---|---|---|---|---|
| FY2019 | 39,590 | 891 | 13.5% | 4,712 | 271,401 | 900 | 19.7% | 10,735 |
| FY2020 | 39,057 | 891 | 14.4% | 4,601 | 264,812 | 886 | 19.7% | 10,815 |
| FY2021 | 39,494 | 912 | 16.0% | 4,287 | 260,047 | 876 | 19.8% | 10,476 |
| FY2022 | 38,769 | 906 | 15.5% | 4,296 | 256,459 | 870 | 18.8% | 10,427 |
| FY2023 | 37,815 | 899 | 16.4% | 3,777 | 250,839 | 856 | 20.0% | 9,498 |
| FY2024 | 37,153 | 891 | 16.9% | 3,618 | 242,152 | 835 | 18.2% | 10,402 |
Karatsu and Saga trends (FY2019 to FY2024)
Karatsu City's total waste went from 39,590 tonnes in FY2019 to 37,153 tonnes in FY2024, its recycling rate from 13.5% to 16.9%, and its final disposal from 4,712 to 3,618 tonnes. Waste per person per day was 891 g in FY2019, 912 g in FY2021 and 891 g in FY2024. For Saga Prefecture as a whole, total waste went from 271,401 to 242,152 tonnes, per person per day from 900 to 835 g, and the recycling rate from 19.7% to 18.2%.
Japan's total municipal solid waste in FY2024 was 38.11 million tonnes, 2.2% less than in FY2023. The Ministry describes total waste as "decreasing since FY2015" and the recycling rate as "slightly decreasing again since FY2021" (MOE press release on municipal solid waste in FY2024 (27 March 2026, in Japanese); our translation).
| Material | Karatsu City | Saga Prefecture (20 municipalities) |
|---|---|---|
| Paper | 600 | 7,717 |
| Paper cartons | 1 | 32 |
| Paper containers and packaging | 207 | 260 |
| Mixed paper | 0 | 160 |
| Metals | 703 | 5,128 |
| Glass | 367 | 3,396 |
| PET bottles | 220 | 1,611 |
| White trays | 0 | 10 |
| Plastic containers and packaging | 0 | 469 |
| Plastic products | 0 | 80 |
| Other plastics | 1 | 16 |
| Textiles | 137 | 743 |
| Compost | 0 | 2,698 |
| Molten slag | 0 | 4,591 |
| Solid fuel (RDF, RPF) | 0 | 57 |
| Fuel (excluding solid fuel) | 0 | 1,618 |
| Incineration ash and fly ash to cement feedstock | 0 | 8,696 |
| Fly ash metal recovery | 0 | 530 |
| Used cooking oil (BDF) | 7 | 48 |
| Used cooking oil (other) | 0 | 111 |
| Other | 4,036 | 6,224 |
| Total | 6,279 | 44,195 |
What is recycled (by material, FY2024)
Of Karatsu City's 6,279 tonnes recycled, 4,036 tonnes are in the source's "other" category, followed by metals 703 t, paper 600 t, glass 367 t, PET bottles 220 t, paper containers and packaging 207 t and textiles 137 t. Plastic containers and packaging and plastic products were 0 tonnes, and other plastics 1 tonne. For Saga Prefecture as a whole: plastic containers and packaging 469 t, plastic products 80 t and PET bottles 1,611 t.
| Municipality | Total recycled | PET bottles | Plastic containers and packaging | Plastic products |
|---|---|---|---|---|
| Saga City | 15,006 | 504 | 1 | 0 |
| Karatsu City | 6,279 | 220 | 0 | 0 |
| Tosu City | 6,149 | 109 | 42 | 11 |
| Taku City | 449 | 30 | 45 | 0 |
| Imari City | 2,310 | 135 | 0 | 0 |
| Takeo City | 2,552 | 125 | 0 | 0 |
| Kashima City | 1,352 | 65 | 61 | 3 |
| Ogi City | 1,811 | 79 | 91 | 52 |
| Ureshino City | 1,493 | 67 | 97 | 14 |
| Kanzaki City | 566 | 43 | 43 | 0 |
| Yoshinogari Town | 380 | 44 | 1 | 0 |
| Kiyama Town | 1,361 | 0 | 0 | 0 |
| Kamimine Town | 462 | 16 | 13 | 0 |
| Miyaki Town | 1,248 | 51 | 51 | 0 |
| Genkai Town | 65 | 14 | 0 | 0 |
| Arita Town | 752 | 42 | 0 | 0 |
| Omachi Town | 292 | 10 | 0 | 0 |
| Kohoku Town | 408 | 5 | 19 | 0 |
| Shiroishi Town | 869 | 36 | 0 | 0 |
| Tara Town | 391 | 16 | 5 | 0 |
| Saga Prefecture (20 municipalities) | 44,195 | 1,611 | 469 | 80 |
PET bottles and plastics recycled (20 municipalities, FY2024)
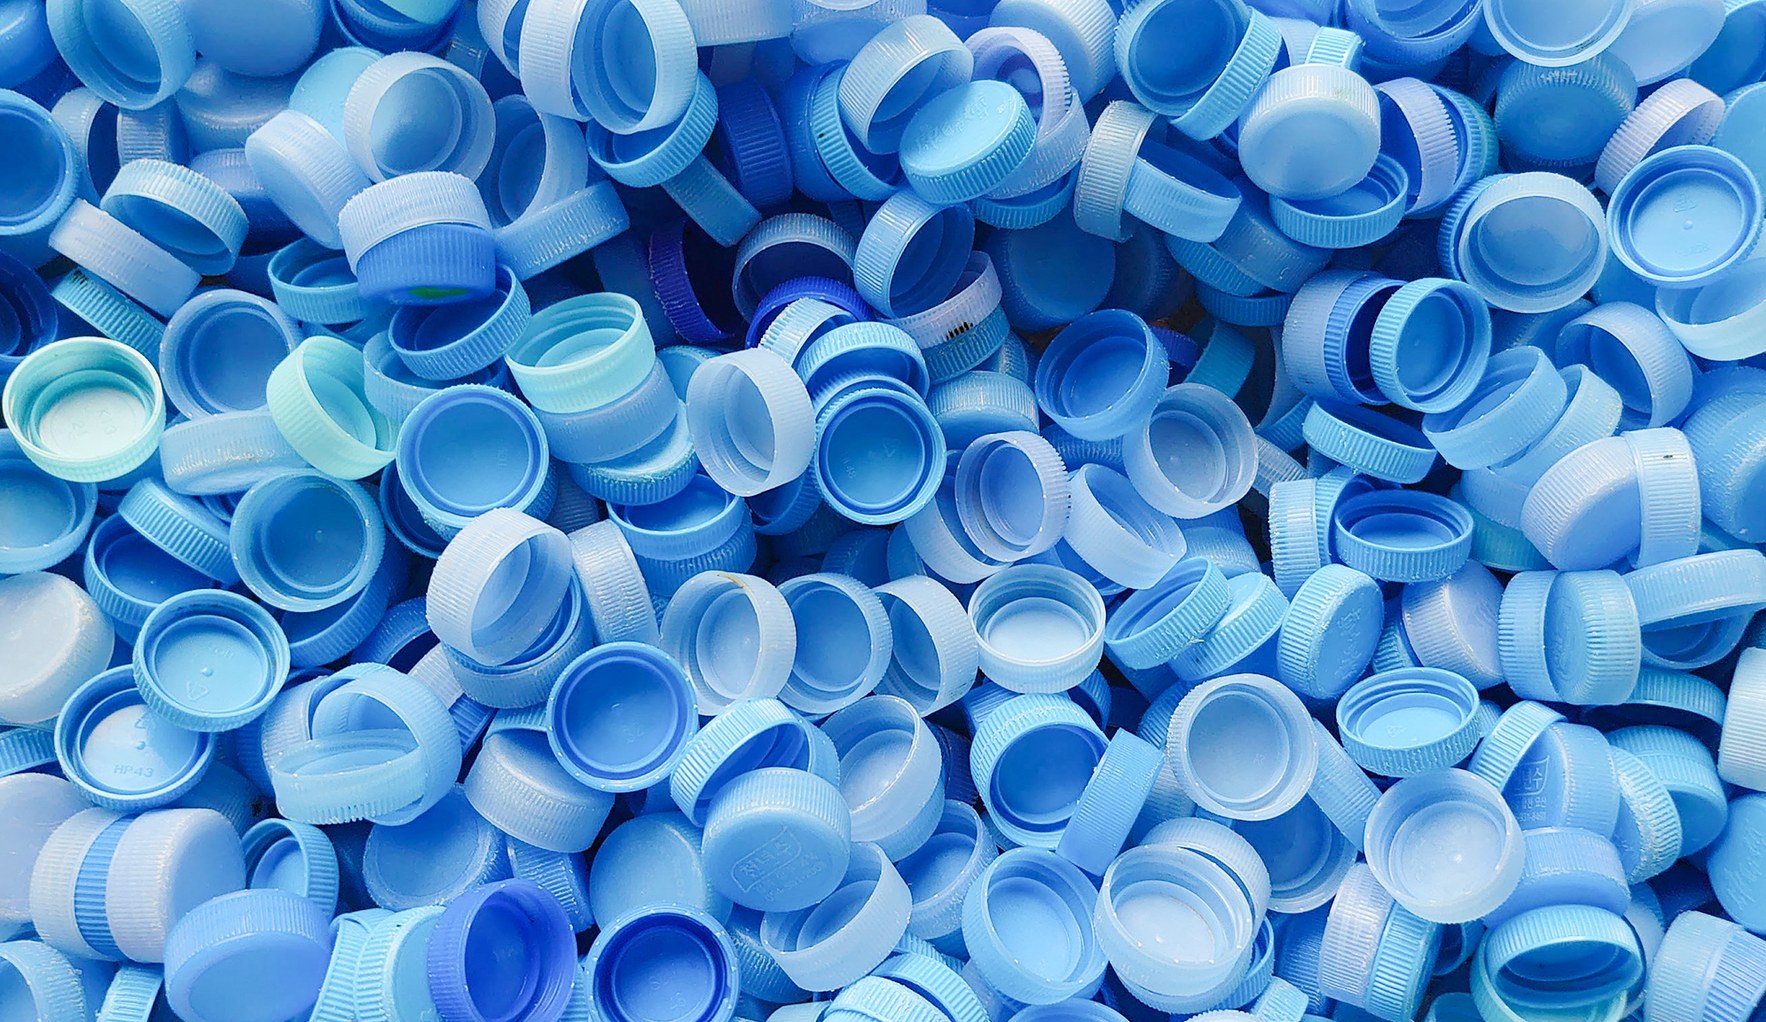
Twelve municipalities recycled some plastic containers and packaging, led by Ureshino City 97 t, Ogi City 91 t, Kashima City 61 t, Miyaki Town 51 t, Taku City 45 t, Kanzaki City 43 t and Tosu City 42 t; eight, including Karatsu City, recycled 0 tonnes. Plastic products were recycled in four cities (Ogi 52 t, Ureshino 14 t, Tosu 11 t, Kashima 3 t) and 0 tonnes in the other sixteen. Our own work collecting plastic bottle caps in Karatsu and remaking them into new products is described on Precious Plastic Karatsu.
| Item | JPY thousand | JPY bn | Breakdown (JPY thousand) |
|---|---|---|---|
| Contracted services | 1,062,725 | 1.06 | collection and transport 746,107; intermediate treatment 300,392; final disposal 14,983; other 1,243 |
| Treatment costs | 859,088 | 0.86 | collection and transport 4,414; intermediate treatment 716,658; final disposal 138,016 |
| Other | 147,970 | 0.15 | |
| Personnel | 117,809 | 0.12 | general staff 26,905; collection and transport 64,066; intermediate treatment 0; final disposal 26,838 |
| Vehicles and equipment | 0 | 0.00 | |
| Construction and improvement | 0 | 0.00 | |
| Research | 0 | 0.00 | |
| Total | 2,187,592 | 2.19 |
Karatsu City's waste money: what it is spent on (FY2024)
Karatsu City spent JPY 2,187,592 thousand (JPY 2.19 billion) on waste management in FY2024: contracted services JPY 1,062,725 thousand (of which collection and transport 746,107), treatment costs JPY 859,088 thousand (of which intermediate treatment 716,658 and final disposal 138,016), personnel JPY 117,809 thousand and other JPY 147,970 thousand. Construction and improvement spending was JPY 0 (MOE, Municipal Solid Waste Survey FY2024, Saga results (costs)).
Dividing JPY 2,187,592 thousand by the survey's population of 114,227 gives about JPY 19,150 per person (our calculation). Japan's total waste management costs were JPY 2.4489 trillion, which the Ministry gives as JPY 19,700 per person (MOE press release on municipal solid waste in FY2024 (27 March 2026, in Japanese)).
| Source of funds | JPY thousand | JPY bn |
|---|---|---|
| General revenue sources | 1,240,208 | 1.24 |
| Other | 545,957 | 0.55 |
| Fees and charges | 291,136 | 0.29 |
| Prefectural disbursements | 110,291 | 0.11 |
| National treasury disbursements | 0 | 0.00 |
| Local bonds | 0 | 0.00 |
| Total | 2,187,592 | 2.19 |
Karatsu City's waste money: where it comes from (FY2024)
Of the JPY 2,187,592 thousand, general revenue sources covered JPY 1,240,208 thousand (JPY 1.24 billion) and earmarked sources JPY 947,384 thousand: "other" JPY 545,957 thousand, fees and charges JPY 291,136 thousand and prefectural disbursements JPY 110,291 thousand. National treasury disbursements and local bonds were JPY 0. Karatsu City's overall revenue and spending are on Karatsu City Finances in Numbers.
FAQ
Q1. What is Karatsu City's recycling rate?
16.9% in FY2024. Saga Prefecture as a whole (20 municipalities) was 18.2% and Japan 19.3% (MOE Municipal Solid Waste Survey).
Q2. How much waste does each person in Karatsu produce per day?
Total waste in FY2024 was 37,153 tonnes, or 891 grams per person per day. Saga Prefecture was 835 g and Japan 839 g (MOE Municipal Solid Waste Survey).
Q3. Which municipalities in Saga have the highest recycling rates?
In FY2024: Kiyama Town 24.0%, Tosu City 23.2%, Ureshino City 21.0% and Tara Town 20.8%. The lowest were Genkai Town 5.3%, Kanzaki City 7.3% and Yoshinogari Town 8.2% (MOE Municipal Solid Waste Survey).
Q4. How much does waste management cost Karatsu City?
JPY 2,187,592 thousand (JPY 2.19 billion) in FY2024, including contracted services JPY 1,062,725 thousand, treatment costs JPY 859,088 thousand and personnel JPY 117,809 thousand. General revenue sources covered JPY 1,240,208 thousand (MOE Municipal Solid Waste Survey).
Q5. How much plastic does Karatsu City recycle?
In FY2024: PET bottles 220 tonnes, plastic containers and packaging 0 tonnes, plastic products 0 tonnes and other plastics 1 tonne (MOE Municipal Solid Waste Survey).
Sources
| Source | Publisher | Date | URL | Accessed |
|---|---|---|---|---|
| Municipal Solid Waste Survey, FY2024 results (in Japanese) | Ministry of the Environment | not stated | https://www.env.go.jp/recycle/waste_tech/ippan/r6/index.html | 2026-11-02 |
| FY2024 Saga results, waste treatment (Excel) | Ministry of the Environment | not stated | https://www.env.go.jp/recycle/waste_tech/ippan/r6/data/shori/city/41/01.xlsx | 2026-11-02 |
| FY2024 Saga results, costs (Excel) | Ministry of the Environment | not stated | https://www.env.go.jp/recycle/waste_tech/ippan/r6/data/shori/city/41/04.xlsx | 2026-11-02 |
| FY2019 to FY2023 Saga results, waste treatment (Excel) | Ministry of the Environment | not stated | https://www.env.go.jp/recycle/waste_tech/ippan/stats.html | 2026-11-02 |
| Municipal solid waste generation and treatment in FY2024 (press release) | Ministry of the Environment | 2026-03-27 | https://www.env.go.jp/press/press_03502.html | 2026-11-02 |
| Results of the FY2024 Municipal Solid Waste Survey (press release attachment, PDF) | Ministry of the Environment | 2026-03-27 | https://www.env.go.jp/content/000387426.pdf | 2026-11-02 |
Notes on reading the figures
Population in this survey is as of 1 October 2024, partly 31 March 2025 (MOE press release attachment). Grams per person per day are divided by the total population including foreign residents, so they differ slightly from figures calculated with the resident register. Each year uses that year's own survey results.
What this page does not cover
This page covers only municipal solid waste (household and business waste handled by municipalities and joint unions). It does not cover industrial waste, night soil, disaster waste, beach litter, each municipality's sorting rules or collection days, the price of designated bags, details of individual facilities, or any evaluation of waste management or comparison of merit between municipalities. Costs are shown for Karatsu City only: many Saga municipalities treat waste through joint unions, so the municipal columns alone do not allow a like-for-like cost comparison.
Citing this page and enquiries
To cite these figures, or to ask about finding local data, use our contact page or info@karatsu-f-f.com.
About this page
By Hiroaki Kojima (Vice Director, Karatsu Farm & Food) / Contact: info@karatsu-f-f.com (contact page) / Published 2 November 2026 / Markdown: saga-waste-data.mdThis page is made together with AI. See this data bank and AI for how.
Related links
▶ Karatsu Data Bank
▶ Plastics in Numbers
▶ Plastic Rankings by Country
▶ Circular Economy in Numbers
▶ Karatsu City Finances in Numbers
▶ 日本語版