
How much does agriculture produce in Karatsu, and where does it rank in Saga?
MAFF estimates Karatsu City's agricultural output in 2024 at JPY 26.17 billion, 1st of Saga's 20 municipalities and 68th among Japan's municipalities. Saga City was 2nd (JPY 20.13 bn) and Shiroishi Town 3rd (JPY 18.45 bn) (MAFF, Municipal Agricultural Output Estimates 2024 (in Japanese)). The figure allocates each prefecture's output by product to municipalities using planted areas and livestock numbers from the Census of Agriculture and Forestry and harvest volumes from crop statistics, so it does not reflect differences in price or yield between municipalities. Some items (such as piglets) are not counted, so municipal totals do not add up to the prefecture's output.
Karatsu Farm & Food made this page as part of the Karatsu Data Bank. It sets out, as published by MAFF, Saga Prefecture and the Karatsu City Agricultural Committee, how much Karatsu's farms produce and how many people farm how much land, alongside Saga's 20 municipalities. We add no conclusions or evaluations. Where we have sorted figures or calculated shares, we say so ("our calculation"). Karatsu's population is on Karatsu City Population and Migration in Numbers and its budget on Karatsu City Finances in Numbers.
| Rank in Saga | Municipality | Output | Rank in Japan | Rice | Vegetables | Fruit | Livestock |
|---|---|---|---|---|---|---|---|
| 1 | Karatsu | 26.17 | 68 | 2.57 | 8.02 | 3.48 | 10.10 |
| 2 | Saga | 20.13 | 113 | 8.44 | 4.79 | 2.01 | 2.56 |
| 3 | Shiroishi | 18.45 | 134 | 4.35 | 11.87 | 0.18 | 1.06 |
| 4 | Imari | 10.92 | 306 | 1.72 | 1.64 | 2.37 | 4.99 |
| 5 | Tara | 8.33 | 401 | 0.25 | 0.50 | 3.95 | 3.26 |
| 6 | Kashima | 7.98 | 420 | 1.14 | 1.57 | 3.57 | 0.88 |
| 7 | Takeo | 7.16 | 470 | 1.88 | 1.72 | 0.22 | 3.07 |
| 8 | Ogi | 5.95 | 551 | 2.74 | 1.42 | 0.83 | 0.49 |
| 9 | Genkai | 5.27 | 599 | 0.38 | 0.80 | 0.40 | 3.60 |
| 10 | Kanzaki | 5.01 | 624 | 2.74 | 1.08 | 0.10 | 0.47 |
| 11 | Ureshino | 3.61 | 787 | 1.03 | 0.55 | 0.21 | 0.61 |
| 12 | Taku | 3.45 | 805 | 0.73 | 0.25 | 1.15 | 1.17 |
| 13 | Tosu | 3.41 | 811 | 1.07 | 0.56 | 0.16 | 1.38 |
| 14 | Arita | 2.96 | 871 | 0.41 | 0.32 | 0.12 | 2.09 |
| 15 | Miyaki | 2.80 | 896 | 1.56 | 0.52 | 0.05 | 0.23 |
| 16 | Kohoku | 2.60 | 925 | 0.87 | 0.86 | 0.24 | 0.41 |
| 17 | Yoshinogari | 1.01 | 1,258 | 0.67 | 0.21 | 0.02 | 0.01 |
| 18 | Kamimine | 0.80 | 1,328 | 0.38 | 0.14 | 0.04 | 0.19 |
| 19 | Kiyama | 0.51 | 1,431 | 0.18 | 0.11 | 0.11 | 0.06 |
| 20 | Omachi | 0.48 | 1,445 | 0.23 | 0.15 | 0.01 | - |
What does Karatsu produce, and how much of each?
By category, livestock was the largest in 2024 at JPY 10.10 billion, followed by vegetables JPY 8.02 bn, fruit JPY 3.48 bn, rice JPY 2.57 bn and flowers JPY 1.07 bn. By item, beef cattle (JPY 5.67 bn) ranked 17th among Japan's municipalities, strawberries (JPY 2.17 bn) 19th and cucumbers (JPY 1.19 bn) 20th (MAFF, Municipal Agricultural Output Estimates 2024 (in Japanese)). Livestock made up 38.6% and vegetables 30.6% (our calculation).
| Item | Output (JPY bn) | Rank in Japan | Rank in Saga |
|---|---|---|---|
| Beef cattle | 5.67 | 17 | 1 |
| Broiler chickens | 2.28 | 47 | 1 |
| Strawberries | 2.17 | 19 | 1 |
| Mandarin oranges | 1.88 | 24 | 3 |
| Pigs | 1.62 | 129 | 2 |
| Cucumbers | 1.19 | 20 | 1 |
| Flowers | 1.07 | 67 | 1 |
| Green onions | 1.03 | 24 | 1 |
| Tomatoes | 0.41 | 122 | 1 |
| Spinach | 0.31 | 58 | 1 |
| Eggs | 0.26 | 241 | 1 |
How has Karatsu's agricultural output changed since 2019?
Karatsu City's estimated agricultural output was JPY 23.29 bn in 2019, 23.59 bn in 2020, 23.52 bn in 2021, 24.20 bn in 2022, 24.72 bn in 2023 and 26.17 bn in 2024 (MAFF, Municipal Agricultural Output Estimates, each year). Livestock rose from JPY 8.97 bn in 2019 to 10.10 bn in 2024, and rice from JPY 1.99 bn to 2.57 bn.
| Year | Output | Rice | Vegetables | Fruit | Livestock | of which beef cattle |
|---|---|---|---|---|---|---|
| 2019 | 23.29 | 1.99 | 6.69 | 3.40 | 8.97 | 4.71 |
| 2020 | 23.59 | 1.98 | 7.04 | 3.36 | 9.07 | 4.67 |
| 2021 | 23.52 | 1.88 | 6.37 | 3.42 | 9.48 | 5.20 |
| 2022 | 24.20 | 2.03 | 7.15 | 3.21 | 9.63 | 5.22 |
| 2023 | 24.72 | 2.16 | 6.81 | 3.53 | 9.97 | 5.29 |
| 2024 | 26.17 | 2.57 | 8.02 | 3.48 | 10.10 | 5.67 |
How many farms and farm households are there in Karatsu?
In the 2025 Census of Agriculture and Forestry (as of 1 February 2025), Karatsu City had 2,313 farm management entities and 2,931 farm households (2,221 commercial and 710 self-sufficient), the largest numbers among Saga's 20 municipalities (Saga Prefecture, 2025 Census of Agriculture and Forestry: Saga Summary (final, in Japanese), statistical tables). Of the farm management entities, 2,226 were individual farms and 68 were incorporated. Across Saga Prefecture, farm management entities fell from 17,020 in 2015 to 14,330 in 2020 and 12,403 in 2025, a 13.4% fall in five years (Saga Prefecture's summary of results (in Japanese)).
| Municipality | Farm management entities | Farm households | Cultivated land (ha) | Per entity (ha) | Core farm workers | Average age |
|---|---|---|---|---|---|---|
| Karatsu | 2,313 | 2,931 | 3,638 | 1.6 | 3,543 | 65.7 |
| Saga | 1,978 | 2,279 | 9,983 | 5.2 | 2,425 | 65.6 |
| Imari | 1,382 | 1,847 | 1,844 | 1.4 | 1,556 | 68.8 |
| Shiroishi | 1,204 | 1,247 | 5,773 | 4.9 | 1,991 | 63.7 |
| Ureshino | 749 | 1,103 | 1,505 | 2.1 | 655 | 68.2 |
| Kashima | 677 | 943 | 1,914 | 2.9 | 906 | 67.6 |
| Kanzaki | 594 | 660 | 2,713 | 4.7 | 648 | 67.5 |
| Ogi | 505 | 568 | 3,145 | 6.3 | 657 | 64.9 |
| Tara | 484 | 573 | 723 | 1.6 | 651 | 67.3 |
| Taku | 434 | 552 | 901 | 2.1 | 483 | 68.9 |
| Arita | 427 | 583 | 608 | 1.5 | 351 | 68.9 |
| Takeo | 365 | 700 | 2,360 | 7.2 | 390 | 66.3 |
| Genkai | 304 | 395 | 595 | 2.0 | 487 | 64.1 |
| Miyaki | 266 | 294 | 1,772 | 6.8 | 301 | 66.1 |
| Kohoku | 187 | 203 | 1,057 | 5.7 | 274 | 62.5 |
| Tosu | 181 | 338 | 985 | 5.7 | 163 | 67.8 |
| Yoshinogari | 118 | 180 | 701 | 5.9 | 127 | 67.3 |
| Kiyama | 113 | 247 | 354 | 3.2 | 125 | 70.3 |
| Kamimine | 62 | 89 | 376 | 6.6 | 64 | 66.4 |
| Omachi | 60 | 66 | 252 | 5.0 | 62 | 64.9 |
| Saga Prefecture | 12,403 | 15,798 | 41,198 | 3.4 | 15,859 | 66.2 |
By the sector bringing in the most sales, 876 of Karatsu's farm management entities were in rice, 431 in greenhouse vegetables, 398 in fruit trees, 215 in open-field vegetables and 106 in beef cattle (2025, of 2,215 entities with sales). Of the 2,226 individual farms, 749 were principal farms (mainly farm income, with a household member under 65 farming 60 days or more a year) and 1,272 were side-business farms (Saga Prefecture, 2025 Census of Agriculture and Forestry: Saga Summary (final, in Japanese), statistical tables 2(7), 2(13)).
How many people farm in Karatsu, and how old are they?
In 2025 Karatsu City had 3,543 core farm workers (2,085 men, 1,458 women), with an average age of 65.68. 2,270 (64.1%) were 65 or older and 1,738 (49.1%) were 70 or older (Saga Prefecture, 2025 Census of Agriculture and Forestry: Saga Summary (final, in Japanese), statistical tables 2(14); shares are our calculation). Core farm workers are household members of individual farms whose usual main work is their own farming. Across Saga there were 15,859, down 3,156 (16.6%) in five years (Saga Prefecture's summary of results (in Japanese)).
| Age | Karatsu | Karatsu share | Saga | Saga share |
|---|---|---|---|---|
| 15-29 | 57 | 1.6% | 253 | 1.6% |
| 30-39 | 134 | 3.8% | 632 | 4.0% |
| 40-49 | 360 | 10.2% | 1,504 | 9.5% |
| 50-59 | 386 | 10.9% | 1,642 | 10.4% |
| 60-64 | 336 | 9.5% | 1,432 | 9.0% |
| 65-69 | 532 | 15.0% | 2,407 | 15.2% |
| 70-79 | 1,334 | 37.7% | 5,862 | 37.0% |
| 80+ | 404 | 11.4% | 2,127 | 13.4% |
| Total | 3,543 | 100.0% | 15,859 | 100.0% |
How much farmland does Karatsu have, and how much is unused?
In 2025 Karatsu City's cultivated land was 3,638 ha: 2,249 ha of paddy, 921 ha of upland fields and 468 ha of orchards. Per entity it was 1.6 ha, less than half the Saga average of 3.4 ha (Saga Prefecture, 2025 Census of Agriculture and Forestry: Saga Summary (final, in Japanese), statistical tables 2(2)). Of the cultivated land, 1,371 ha was rented.
The Karatsu City Agricultural Committee's guidelines give 6,520 ha of farmland in the city in April 2023, of which 44.9 ha (0.7%) was idle and 3,650 ha (56.0%) was consolidated with core farmers. The committee's targets for April 2026 are 31.5 ha (0.5%) of idle farmland and 59.3% consolidation (Karatsu City Agricultural Committee, Guidelines on Optimising Farmland Use (in Japanese), 28 June 2023). Idle farmland is the same as MAFF's "abandoned farmland that can be restored" (MAFF, Farmland Statistics (in Japanese)). For Saga Prefecture, abandoned farmland at 31 March 2025 was 8,210 ha, of which 1,795 ha could be restored and 6,416 ha was judged difficult to restore. In FY2024, 835 ha newly became abandoned and 51 ha was brought back into use (MAFF, Abandoned Farmland Area FY2024 (in Japanese)).
| Item | Area | Date and source |
|---|---|---|
| Cultivated land, Karatsu City | 3,638 ha | 1 Feb 2025 (Saga Prefecture) |
| Paddy | 2,249 ha | Same |
| Upland fields (excluding orchards) | 921 ha | Same |
| Orchards | 468 ha | Same |
| Farmland in the city | 6,520 ha | Apr 2023 (Karatsu City Agricultural Committee) |
| Idle farmland, Karatsu City | 44.9 ha | Same |
| Consolidated with core farmers | 3,650 ha | Same |
| Abandoned farmland, Saga Prefecture | 8,210 ha | 31 Mar 2025 (MAFF) |
| Can be restored | 1,795 ha | Same |
| Difficult to restore | 6,416 ha | Same |
Is anyone in Karatsu keeping rice paddies in use with the local community?
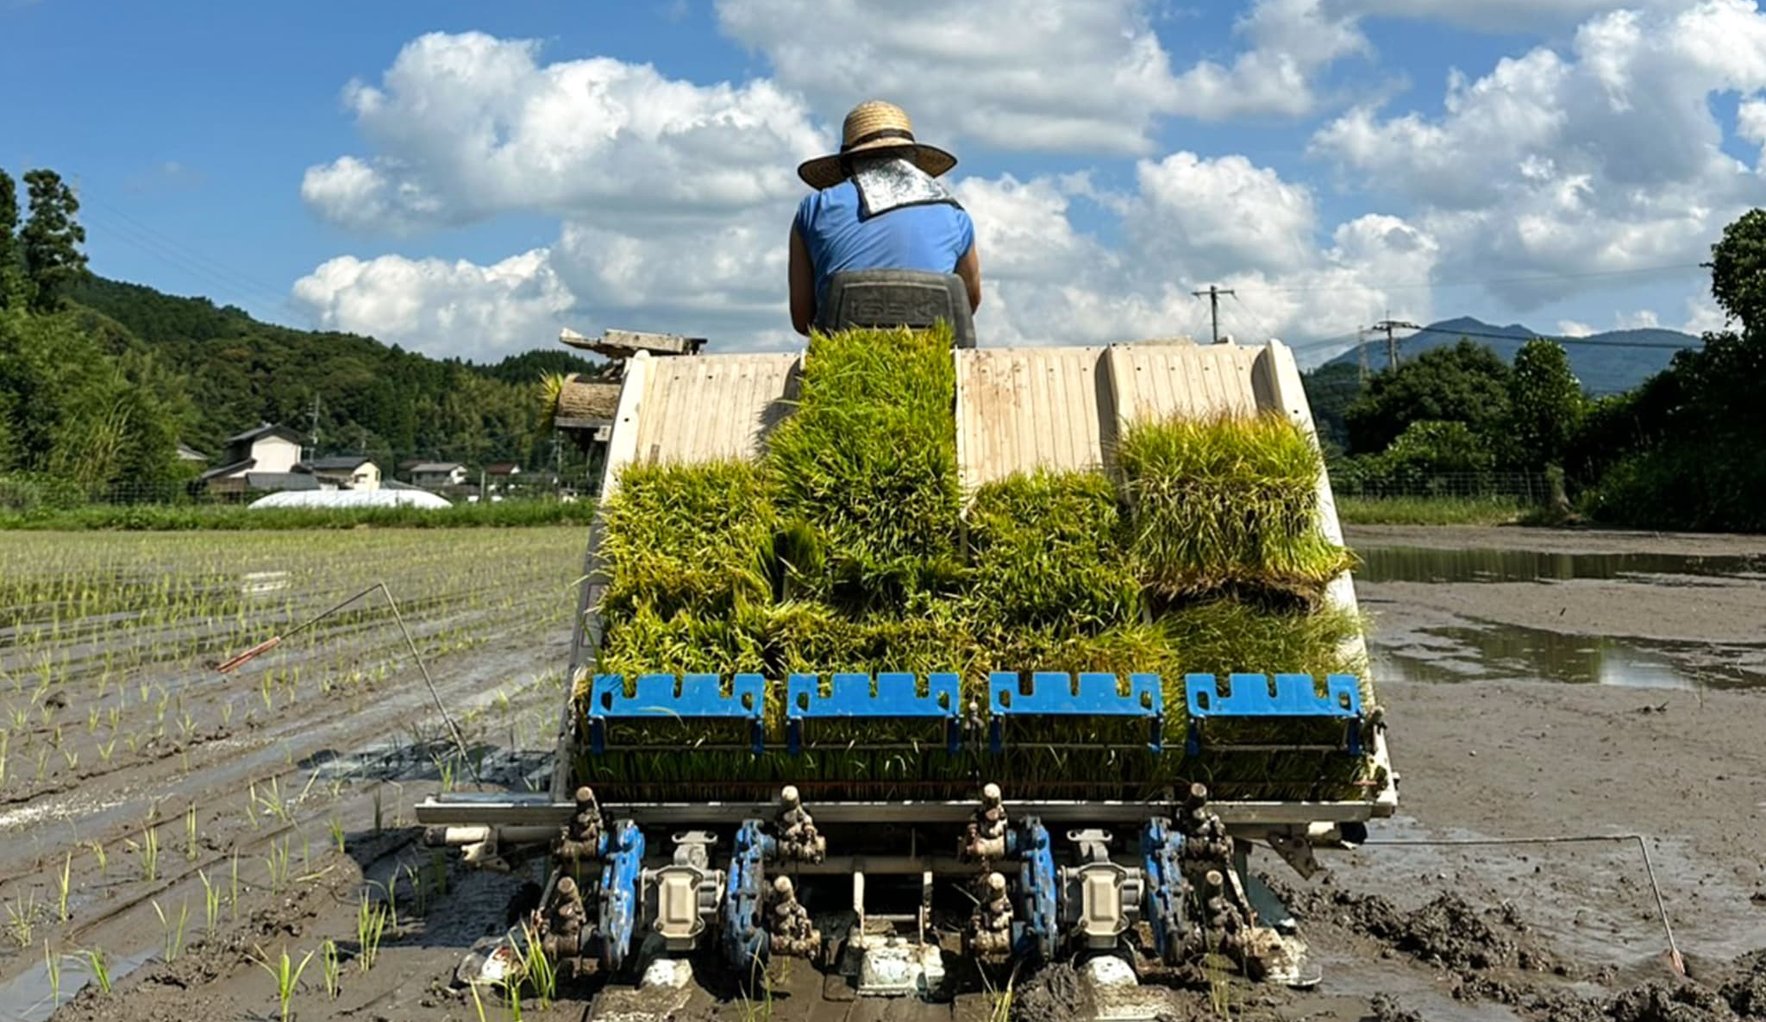
We grow rice and look after waterways and bamboo groves with local people in the satoyama of Yokomakura, Ochi Town, Karatsu, a site certified by the Ministry of the Environment as a Nature Symbiosis Site. See Nature Positive.
FAQ
Q1. What is Karatsu City's agricultural output?
According to MAFF's estimate, Karatsu City's agricultural output in 2024 was JPY 26.17 billion, 1st of Saga's 20 municipalities and 68th among Japan's municipalities. It includes livestock JPY 10.10 bn, vegetables JPY 8.02 bn, fruit JPY 3.48 bn and rice JPY 2.57 bn. The figure is an estimate that allocates the prefecture's output to municipalities by planted area and livestock numbers.
Q2. Which farm product brings in the most in Karatsu?
In the 2024 estimate the largest single item is beef cattle at JPY 5.67 billion (17th among Japan's municipalities), followed by broiler chickens JPY 2.28 bn, strawberries JPY 2.17 bn (19th), mandarin oranges JPY 1.88 bn, pigs JPY 1.62 bn and cucumbers JPY 1.19 bn (20th) (MAFF).
Q3. How many farms are there in Karatsu City?
In the 2025 Census of Agriculture and Forestry (as of 1 February 2025), Karatsu City had 2,931 farm households (2,221 commercial and 710 self-sufficient) and 2,313 farm management entities, both the largest numbers among Saga's 20 municipalities (Saga Prefecture).
Q4. How old are the people farming in Karatsu?
In the 2025 census, Karatsu City had 3,543 core farm workers (household members of individual farms whose main work is their own farming), with an average age of 65.68. 2,270 of them (64.1%, our calculation) were 65 or older. The Saga average was 66.2.
Q5. How much abandoned farmland is there in Karatsu?
The Karatsu City Agricultural Committee's guidelines (June 2023) give 44.9 ha of idle farmland (abandoned land that could be farmed again after restoration), 0.7% of the 6,520 ha of farmland in the city in April 2023. For Saga Prefecture as a whole, abandoned farmland was 8,210 ha at the end of March 2025, of which 6,416 ha was judged difficult to restore (MAFF).
Sources
| Source | Publisher | Date | URL | Retrieved |
|---|---|---|---|---|
| Municipal Agricultural Output Estimates 2024 (in Japanese) | MAFF, Statistics Department | 24 Jul 2026 (corrected 18 Sep 2026) | https://www.maff.go.jp/j/tokei/kouhyou/sityoson_sansyutu/index.html | 5 Nov 2026 |
| Municipal Agricultural Output Estimates 2024, detailed data by item (Excel) | MAFF, Statistics Department | Updated 3 Aug 2026 | https://www.maff.go.jp/j/tokei/kouhyou/sityoson_sansyutu/attach/xls/index-25.xlsx | 5 Nov 2026 |
| Municipal Agricultural Output Estimates 2024, tables (e-Stat) | MAFF | Updated 18 Sep 2026 | https://www.e-stat.go.jp/stat-search/files?page=1&layout=datalist&lid=000001484176 | 5 Nov 2026 |
| Municipal Agricultural Output Estimates 2019-2023, tables (e-Stat) | MAFF | Each year | https://www.e-stat.go.jp/stat-search/files?page=1&layout=datalist&lid=000001456328 | 5 Nov 2026 |
| 2025 Census of Agriculture and Forestry: Saga Summary (final) | Saga Prefecture, Statistics Analysis Division | Updated 10 Jun 2026 | https://www.pref.saga.lg.jp/toukei/kiji003110093/index.html | 5 Nov 2026 |
| Same, statistical tables (Excel) | Saga Prefecture | Jun 2026 | https://www.pref.saga.lg.jp/toukei/kiji003110093/3_110093_up_n70gj7oj.xls | 5 Nov 2026 |
| Same, summary of results (PDF) | Saga Prefecture | Jun 2026 | https://www.pref.saga.lg.jp/toukei/kiji003110093/3_110093_up_i1wz8v7q.pdf | 5 Nov 2026 |
| Abandoned Farmland Area FY2024 | MAFF, Rural Development Bureau | 26 Dec 2025 | https://www.maff.go.jp/j/nousin/tikei/houkiti/attach/pdf/index-47.pdf | 5 Nov 2026 |
| Farmland Statistics | MAFF | https://www.maff.go.jp/j/tokei/sihyo/data/10.html | 5 Nov 2026 | |
| Guidelines on Optimising Farmland Use | Karatsu City Agricultural Committee | 28 Jun 2023 | https://www.city.karatsu.lg.jp/uploaded/attachment/2557.pdf | 5 Nov 2026 |
Notes on reading the figures
Municipal agricultural output is an estimate that allocates the prefecture's output by planted area, livestock numbers and harvest volume, and may differ from actual sales. Items allocated by the census are counted in the municipality where the farm is registered. The census used for the estimate changed in 2019 (2015 to 2020) and 2024 (2020 to 2025), so year-on-year differences include the effect of that change. Census counts of farm management entities and cultivated land cover entities above a minimum size and are counted differently from the Agricultural Committee's farmland area. Saga's abandoned farmland is the prefectural total of municipal surveys; MAFF's figures do not give Karatsu separately.
What this page does not cover
This page does not cover comparison with Karatsu's figures from the 2020 or earlier censuses (the 2020 census figures were corrected and we have not checked the municipal values), the latest abandoned farmland area for Karatsu (we have not checked figures newer than April 2023), agricultural income, farm incomes or subsidies, fisheries and forestry, or any evaluation of individual farms or producing areas.
Citing this page and enquiries
To cite these figures, or to ask about finding local data, use our contact page or info@karatsu-f-f.com.
About this page
By Hiroaki Kojima (Vice Director, Karatsu Farm & Food) / Contact: info@karatsu-f-f.com (contact page) / Published 5 November 2026 / Markdown: karatsu-agriculture-data.mdThis page is made together with AI. See this data bank and AI for how.
Related links
▶ Karatsu Data Bank
▶ Karatsu City Population and Migration in Numbers
▶ Karatsu City Finances in Numbers
▶ Vacant Houses in Karatsu City
▶ Nature Positive
▶ 日本語版