
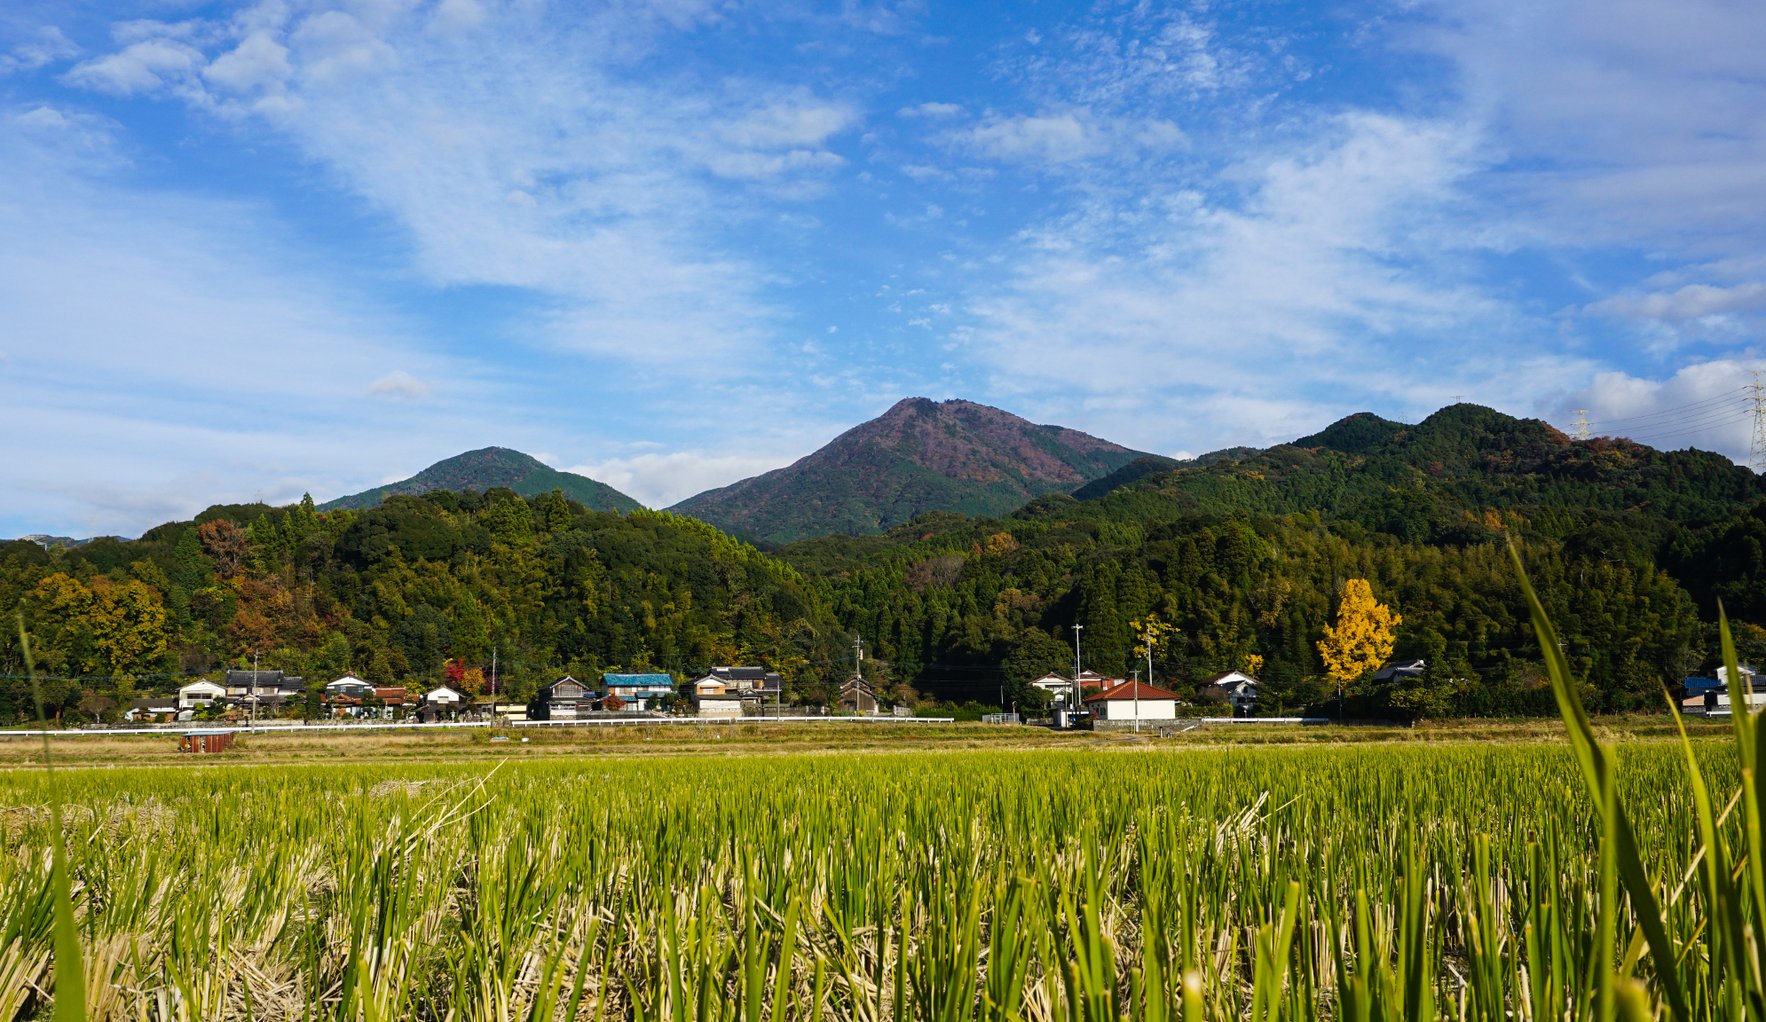
Vacant houses in Karatsu City, in survey figures
In the 2023 Housing and Land Survey by Japan's Ministry of Internal Affairs and Communications (MIC), 7,710 of Karatsu City's 52,130 dwellings were vacant, a vacancy rate of 14.8% (our calculation). The rate was 14.5% for Saga Prefecture (53,300 dwellings) and 13.8% for Japan (9.002 million) (MIC, 2023 Housing and Land Survey, Table 1-2). This page sets out the number and types of vacant houses (akiya) in Karatsu City, trends since 2013, vacancy rates for 15 municipalities in Saga, and the results of Karatsu City's own field survey, using figures published by MIC, Saga Prefecture and Karatsu City.
This page was compiled by Karatsu Farm & Food, a nonprofit in Karatsu, Saga, as part of the Karatsu Data Bank. It lists figures and statements from the sources without conclusions or evaluations. The vacancy rate is vacant dwellings divided by total dwellings; where a source gives no rate we calculated it (one decimal place, rounded half up) and note every calculation or reordering under the tables. English names for Japanese survey categories are our translations. Population trends are on Population and Migration in Numbers: Karatsu and Saga.
The Housing and Land Survey is a sample survey held every five years; the 2023 round was taken as of 1 October. Results are estimates and are published for cities and for towns and villages with 15,000 or more people (MIC summary, in Japanese). A "vacant dwelling" is a dwelling with no resident household, excluding dwellings occupied only temporarily and dwellings under construction (Saga Prefecture, in Japanese).
| Survey year | Total dwellings | Vacant | Vacancy rate | Vacant, other than for rent, sale or second homes | For rent | For sale | Second homes | Dilapidated or damaged |
|---|---|---|---|---|---|---|---|---|
| 2013 | 50,990 | 6,790 | 13.3% | 4,210 | 2,160 | 120 | 310 | 2,370 |
| 2018 | 50,850 | 8,020 | 15.8% | 4,360 | 3,320 | 160 | 180 | 2,080 |
| 2023 | 52,130 | 7,710 | 14.8% | 4,320 | 3,010 | 250 | 130 | 1,750 |
Trends in Karatsu City: 2013, 2018 and 2023
Karatsu City had 6,790 vacant dwellings in 2013 (vacancy rate 13.3%), 8,020 in 2018 (15.8%) and 7,710 in 2023 (14.8%). Total dwellings were 50,990, 50,850 and 52,130 (MIC Housing and Land Survey; rates are our calculation).
Vacant dwellings recorded as dilapidated or damaged numbered 2,370 in 2013, 2,080 in 2018 and 1,750 in 2023, or 34.9%, 25.9% and 22.7% of vacant dwellings (our calculation). "Dilapidated or damaged" means defects in main or other parts of the building, such as patches of fallen exterior wall, cracks in walls or foundations, or missing roof tiles (Saga Prefecture).
| Building type | Vacant | Other than for rent, sale or second homes | For rent | For sale | Second homes |
|---|---|---|---|---|---|
| Detached houses | 4,490 | 3,840 | 360 | 200 | 90 |
| Row houses, apartments and others | 3,220 | 480 | 2,650 | 50 | 40 |
| Total | 7,710 | 4,320 | 3,010 | 250 | 130 |
Types of vacant dwelling in Karatsu City (2023)
Of Karatsu City's 7,710 vacant dwellings in 2023, 4,320 (56.0%) were vacant for reasons other than rent, sale or use as second homes, 3,010 (39.0%) were for rent, 250 (3.2%) for sale and 130 (1.7%) second homes (Table 34-2; shares are our calculation).
In MIC's definitions, the first group covers dwellings whose household is away for a long time, for example because of a job transfer or hospital stay, and dwellings due to be demolished for rebuilding, and also includes dwellings whose type was hard to determine. Second homes are holiday homes and the like (MIC glossary, in Japanese).
By building type, 4,490 vacant dwellings were detached houses, of which 3,840 were in the first group. Of 3,220 vacant row houses, apartments and others, 2,650 were for rent. The first group made up 8.3% of all dwellings in Karatsu City, 7.7% in Saga and 5.9% in Japan (our calculation; the national 5.9% matches MIC's summary).
| Rank | Municipality | Total dwellings | Vacant | Vacancy rate | Of which other than for rent, sale or second homes | Share of all dwellings |
|---|---|---|---|---|---|---|
| 1 | Yoshinogari Town | 7,650 | 1,510 | 19.7% | 400 | 5.2% |
| 2 | Taku City | 8,000 | 1,340 | 16.8% | 1,140 | 14.3% |
| 3 | Shiroishi Town | 8,470 | 1,340 | 15.8% | 1,140 | 13.5% |
| 4 | Saga City | 116,270 | 18,190 | 15.6% | 7,490 | 6.4% |
| 5 | Karatsu City | 52,130 | 7,710 | 14.8% | 4,320 | 8.3% |
| 6 | Ureshino City | 10,740 | 1,550 | 14.4% | 710 | 6.6% |
| 7 | Kanzaki City | 13,320 | 1,820 | 13.7% | 990 | 7.4% |
| 8 | Takeo City | 20,410 | 2,720 | 13.3% | 1,590 | 7.8% |
| 9 | Kashima City | 11,250 | 1,430 | 12.7% | 730 | 6.5% |
| 10 | Imari City | 22,900 | 2,880 | 12.6% | 2,020 | 8.8% |
| 11 | Tosu City | 34,110 | 4,110 | 12.0% | 1,940 | 5.7% |
| 12 | Miyaki Town | 10,920 | 1,290 | 11.8% | 900 | 8.2% |
| 13 | Ogi City | 18,650 | 2,180 | 11.7% | 1,310 | 7.0% |
| 14 | Arita Town | 8,140 | 890 | 10.9% | 730 | 9.0% |
| 15 | Kiyama Town | 7,930 | 770 | 9.7% | 470 | 5.9% |
| Saga Prefecture | 367,900 | 53,300 | 14.5% | 28,300 | 7.7% | |
| Japan | 65,046,700 | 9,001,600 | 13.8% | 3,856,000 | 5.9% |
The 15 municipalities of Saga compared (2023)
Among the 15 municipalities of Saga with published results, the 2023 vacancy rate was highest in Yoshinogari Town (19.7%), Taku City (16.8%), Shiroishi Town (15.8%) and Saga City (15.6%); Karatsu City was fifth at 14.8%. The lowest was Kiyama Town at 9.7%. Saga City had the most vacant dwellings (18,190), followed by Karatsu City (7,710) and Tosu City (4,110) (Table 1-2; rates and ranks are our calculation).
In Yoshinogari Town, 1,030 of 1,510 vacant dwellings were for rent. Measured as the share of all dwellings that are vacant for reasons other than rent, sale or second homes, Taku City (14.3%) and Shiroishi Town (13.5%) were highest; Karatsu City was 8.3% (our calculation).
| Survey year | Vacancy rate (Saga) | Vacancy rate (Japan) | Vacant dwellings (Saga) | Of which dilapidated or damaged (Saga) |
|---|---|---|---|---|
| 1983 | 5.4% | 8.6% | 12,800 | - |
| 1988 | 6.5% | 9.4% | 16,700 | - |
| 1993 | 6.8% | 9.8% | 18,300 | - |
| 1998 | 8.2% | 11.5% | 24,700 | - |
| 2003 | 9.4% | 12.2% | 28,400 | - |
| 2008 | 11.1% | 13.1% | 35,700 | 9,000 |
| 2013 | 12.8% | 13.5% | 43,300 | 13,300 |
| 2018 | 14.3% | 13.6% | 50,500 | 11,400 |
| 2023 | 14.5% | 13.8% | 53,300 | 11,200 |
Saga and Japan since 1983
Saga Prefecture's vacancy rate rose at every survey, from 5.4% in 1983 to 14.5% in 2023, and vacant dwellings from 12,800 to 53,300. Japan's rate went from 8.6% to 13.8%; since 2018 (Saga 14.3%, Japan 13.6%) Saga's rate has been above the national rate (Saga Prefecture).
Saga Prefecture's document states that, compared with 2003, the 2023 vacancy rate was up 2.3 points and the number of vacant dwellings had roughly doubled, and that dilapidated or damaged vacant dwellings (11,200 in 2023) have been on a downward trend since 2013 (13,300) (Saga Prefecture). MIC describes Japan's 9.002 million vacant dwellings as the most ever and the 13.8% rate as the highest ever (MIC).
| District | Presumed vacant buildings | Ratio to households |
|---|---|---|
| Karatsu | 1,378 | 4.1% |
| Hamatama | 197 | 4.6% |
| Kyuragi | 327 | 18.6% |
| Ouchi | 230 | 7.9% |
| Kitahata | 79 | 4.7% |
| Hizen | 312 | 12.6% |
| Chinzei | 266 | 12.6% |
| Yobuko | 220 | 12.1% |
| Nanayama | 98 | 15.3% |
| Karatsu City total | 3,107 | 6.1% |
Karatsu City's own field survey (FY2020)
In FY2020 Karatsu City inspected buildings from the outside across the whole city and identified 3,107 buildings presumed to be vacant. The Karatsu district had 1,378, about 44% of the total, followed by Kyuragi (327) and Hizen (312). The ratio to households was 6.1% citywide, highest in Kyuragi (18.6%) and Nanayama (15.3%), and 5% or less in the Karatsu, Hamatama and Kitahata districts (Karatsu City plan).
| Rank | Condition | Buildings | Share |
|---|---|---|---|
| A | No particular management problems; usable as is | 1,419 | 45.7% |
| B | Not well maintained, but little immediate safety risk | 1,036 | 33.3% |
| C | Not maintained and badly damaged; may become a safety hazard | 423 | 13.6% |
| D | Risk of collapse; repair or demolition urgent | 229 | 7.4% |
| Rank | Marketability | Buildings | Share |
|---|---|---|---|
| A | Easy to sell or rent | 436 | 14.0% |
| B | Some prospect of sale or rental | 482 | 15.5% |
| C | Low prospect of sale or rental | 559 | 18.0% |
| D | Difficult to sell or rent | 1,630 | 52.5% |
Condition and prospects for sale or rental
In the same survey, 1,419 buildings (45.7%) were rank A for condition (usable as is), 1,036 (33.3%) rank B, 423 (13.6%) rank C and 229 (7.4%) rank D (risk of collapse, urgent). For marketability, 436 (14.0%) were rank A (easy to sell or rent), 482 (15.5%) rank B, 559 (18.0%) rank C and 1,630 (52.5%) rank D (difficult to sell or rent) (Karatsu City plan).
The plan reports 440 cumulative complaints from residents about poorly managed vacant properties up to the end of December 2021: 127 resolved for now by measures such as cutting grass, 112 resolved by demolition and 201 under investigation or unresolved. The Karatsu City akiya bank had 151 registrations from FY2016 to the end of December 2021, with 74 contracts concluded (including 48 concluded outside the akiya bank) (Karatsu City plan). The plan covers the five years from FY2022 to FY2026.
From August to November 2026 (planned), Karatsu City is carrying out a new citywide survey of vacant houses by exterior inspection and photographs (Karatsu City notice, updated 19 June 2026, in Japanese). We will add the results to this page when they are published.
Reading the numbers
MIC's Housing and Land Survey (7,710 vacant dwellings) and Karatsu City's field survey (3,107 buildings) count differently. The first is a sample-based estimate that counts each vacant apartment unit for rent and each second home as one dwelling, divided by total dwellings. The second counts buildings that surveyors presumed vacant from the outside, divided by households. This page does not put the two in the same table or compare them.
Municipal figures in the Housing and Land Survey are rounded to the nearest ten and prefectural and national figures to the nearest hundred, so breakdowns may not add up to totals. In 2023 the names and order of vacant-dwelling types were revised, and "other dwellings" became "vacant other than for rent, sale or second homes" (MIC). The vacancy rate includes dwellings for rent and second homes.
Frequently asked questions
Q1. What is Karatsu City's vacancy rate?
In the 2023 Housing and Land Survey, 7,710 of Karatsu City's 52,130 dwellings were vacant, a vacancy rate of 14.8% (our calculation). Saga Prefecture was 14.5% and Japan 13.8%.
Q2. Are vacant houses increasing in Karatsu City?
The Housing and Land Survey counted 6,790 (13.3%) in 2013, 8,020 (15.8%) in 2018 and 7,710 (14.8%) in 2023 (rates are our calculation).
Q3. What are Saga Prefecture's vacancy rate and number of vacant houses?
In 2023, 14.5% and 53,300 dwellings. In 1983 it was 5.4% and 12,800 (Saga Prefecture).
Q4. Which municipalities in Saga have the highest vacancy rates?
Of the 15 with published 2023 results: Yoshinogari Town 19.7%, Taku City 16.8%, Shiroishi Town 15.8%, Saga City 15.6% and Karatsu City 14.8%. The lowest is Kiyama Town at 9.7% (our calculation). Five towns under 15,000 people have no published results.
Q5. How has Karatsu City's akiya bank performed?
According to the Karatsu City Vacant House Countermeasures Plan, it had 151 registrations from FY2016 to the end of December 2021, with 74 contracts concluded (including 48 concluded outside the akiya bank).
Sources
| Source | Publisher | Date | URL | Accessed |
|---|---|---|---|---|
| 2023 Housing and Land Survey: results | MIC Statistics Bureau | not stated | https://www.stat.go.jp/data/jyutaku/2023/tyousake.html | 2026-11-03 |
| 2023 Housing and Land Survey: summary of basic tabulation (final) | MIC | 2024-09-25 | https://www.stat.go.jp/data/jyutaku/2023/pdf/kihon_gaiyou.pdf | 2026-11-03 |
| 2023 Housing and Land Survey: glossary | MIC Statistics Bureau | not stated | https://www.stat.go.jp/data/jyutaku/2023/pdf/yougo.pdf | 2026-11-03 |
| 2023 Table 1-2: dwellings by occupancy status, by municipality (Excel) | MIC (e-Stat) | 2024-09-25 | https://www.e-stat.go.jp/stat-search/file-download?statInfId=000040209842&fileKind=0 | 2026-11-03 |
| 2023 Table 34-2: vacant dwellings by type, condition, building type and structure, by municipality (Excel) | MIC (e-Stat) | 2024-09-25 | https://www.e-stat.go.jp/stat-search/file-download?statInfId=000040209901&fileKind=0 | 2026-11-03 |
| 2018 Table 1-2: dwellings by occupancy status, by municipality (Excel) | MIC (e-Stat) | not stated | https://www.e-stat.go.jp/stat-search/file-download?statInfId=000031865669&fileKind=0 | 2026-11-03 |
| 2018 Table 35-2: vacant dwellings by type, condition, building type and structure, by municipality (Excel) | MIC (e-Stat) | not stated | https://www.e-stat.go.jp/stat-search/file-download?statInfId=000031865730&fileKind=0 | 2026-11-03 |
| 2013 Table 1: dwellings by occupancy status, by municipality (Saga, Excel) | MIC (e-Stat) | not stated | https://www.e-stat.go.jp/stat-search/file-download?statInfId=000027247722&fileKind=0 | 2026-11-03 |
| 2013 Table 25: vacant dwellings by type and condition, by city (Saga, Excel) | MIC (e-Stat) | not stated | https://www.e-stat.go.jp/stat-search/file-download?statInfId=000027248026&fileKind=0 | 2026-11-03 |
| Vacant houses in Saga Prefecture | Saga Prefecture | not stated | https://www.pref.saga.lg.jp/kiji00314386/3_14386_351475_up_lvc0x5j0.pdf | 2026-11-03 |
| Karatsu City Vacant House Countermeasures Plan (PDF) | Karatsu City | March 2022 | https://www.city.karatsu.lg.jp/uploaded/attachment/7443.pdf | 2026-11-03 |
| Karatsu City Vacant House Countermeasures Plan (page) | Karatsu City | updated 2024-12-17 | https://www.city.karatsu.lg.jp/page/4538.html | 2026-11-03 |
| Notice of vacant house survey | Karatsu City | updated 2026-06-19 | https://www.city.karatsu.lg.jp/page/48812.html | 2026-11-03 |
What this page does not cover
This page does not cover the location or owners of individual vacant houses, properties currently listed on the akiya bank, prices or rents, the amounts of renovation or demolition subsidies, or property tax treatment. It has no figures for the five towns in Saga without municipal results in the Housing and Land Survey. It does not cover our own projects.
Citing this page and enquiries
To cite these figures, or to ask about finding local data, use our contact page or info@karatsu-f-f.com.
About this page
By Hiroaki Kojima (Vice Director, Karatsu Farm & Food) / Contact: info@karatsu-f-f.com (contact page) / Published 3 November 2026 / Markdown: karatsu-akiya-data.mdThis page is made together with AI. See this data bank and AI for how.
Related links
▶ Karatsu Data Bank
▶ Population and Migration in Numbers: Karatsu and Saga
▶ Karatsu City Finances in Numbers
▶ Saga Prefecture Waste and Recycling Data
▶ Remote Islands in Numbers
▶ 日本語版