
What types of marine litter are most common? (2026)
In Japan's FY2024 beach litter composition survey, compiled by the Ministry of the Environment, 117,366 artificial items weighing 6,793 kg were collected at 80 beach sites in 39 prefectures. The most common item by count was oyster-farming spacer tubes (fishing gear about 1.5 cm long), at 28,761 items (24.5%), and the heaviest category was wood (timber etc.), at 1,880 kg (28.9%). Plastics, including foamed polystyrene, made up 92% of items and 60% of weight (Ministry of the Environment, "Results of the FY2024 beach litter composition survey" (March 2026, in Japanese)).
Karatsu Farm & Food made this page as part of the Karatsu Data Bank. It focuses on the types of litter that wash up on beaches and lists published figures as they appear in the source tables: the world (International Coastal Cleanup), Japan (the Ministry of the Environment's composition survey), Saga Prefecture (the prefecture's plan and the ranking for the zone that includes Saga), and our own activity in Karatsu. We add no conclusions or evaluations. Item names are our translations of the Ministry's Japanese categories. Japanese fiscal year FY2024 (Reiwa 6) runs from April 2024 to March 2025.
| Question | Figure | As of | Publisher |
|---|---|---|---|
| Most common beach litter item by count (Japan) | Oyster-farming spacer tubes, 28,761 (24.5%) | FY2024 | Ministry of the Environment |
| Heaviest beach litter category (Japan) | Wood (timber etc.), 1,880 kg (28.9%) | FY2024 | Ministry of the Environment |
| Artificial items collected (total of 80 survey sites) | 117,366 items, 6,793 kg | FY2024 | Ministry of the Environment |
| Share of plastics | 92% of items, 60% by weight | FY2024 | Ministry of the Environment |
| Plastics thought to come from use at sea (sea-based) | 50% of items, 32% by weight | FY2024 | Ministry of the Environment |
| Most counted item in beach clean-ups worldwide | Plastic beverage bottles, 1,338,712 | 2025 | Ocean Conservancy |
Most common litter on the world's shores (International Coastal Cleanup 2025)
In the International Coastal Cleanup run each year by the US environmental NGO Ocean Conservancy, 630,069 people took part in 2025 and removed 13,861,048 items weighing 3,586,528 kg. By item, plastic beverage bottles (1,338,712), cigarette butts (1,197,920) and plastic bottle caps (885,854) led the list (Ocean Conservancy, 2026 International Coastal Cleanup Report, p13).
| Rank | Item | Items |
|---|---|---|
| 1 | Beverage bottles (plastic) | 1,338,712 |
| 2 | Cigarette butts | 1,197,920 |
| 3 | Bottle caps (plastic) | 885,854 |
| 4 | Beverage cans | 840,046 |
| 5 | Food wrappers (candy, chips, etc.) | 809,645 |
| 6 | Grocery bags (plastic) | 581,408 |
| 7 | Other bags (plastic) | 562,077 |
| 8 | Food containers (plastic) | 513,745 |
| 9 | Straws/stirrers (plastic) | 445,383 |
| 10 | Cups, plates (paper) | 416,420 |
Over the 40 years from 1986 to 2025, the top items were cigarette butts (65,632,086), food wrappers (32,469,436), plastic beverage bottles (26,967,584), plastic bottle caps (20,466,040) and straws/stirrers (16,310,248) (same report, p3).
| Rank | Item | Items recorded in Japan |
|---|---|---|
| 1 | Cigarette butts | 12,141 |
| 2 | Food wrappers (candy, chips, etc.) | 5,986 |
| 3 | Bottle caps (plastic) | 5,876 |
| 4 | Beverage bottles (plastic) | 5,182 |
| 5 | Other bags (plastic) | 4,170 |
| 6 | Food containers (plastic) | 2,826 |
| 7 | Beverage cans | 2,387 |
| 8 | Grocery bags (plastic) | 1,457 |
| 9 | Straws/stirrers (plastic) | 1,179 |
| 10 | Cups, plates (paper) | 456 |
Japan's beach litter ranked by item (FY2024, by count)
| Rank | Item | Items | Share | FY2023 rank |
|---|---|---|---|---|
| 1 | Oyster-farming spacer tubes (about 1.5 cm) (fishing gear) | 28,761 | 24.5% | 1 |
| 2 | Plastic rope and string (fishing gear) | 13,580 | 11.6% | 3 |
| 3 | Bottle caps and lids | 13,408 | 11.4% | 4 |
| 4 | Other fishing and angling gear | 6,466 | 5.5% | 10 |
| 5 | Beverage PET bottles under 1 L | 5,735 | 4.9% | 5 |
| 6 | Oyster-farming pipes (10 to 20 cm) (fishing gear) | 5,266 | 4.5% | 2 |
| 7 | Plastic bags (opaque and clear) | 5,100 | 4.2% | 7 |
| 8 | Other plastics (required items) | 4,953 | 3.6% | 6 |
| 9 | Wood (timber etc.) | 4,168 | 3.1% | 12 |
| 10 | Plastic food containers (tableware, containers, trays, condiment containers) | 3,606 | 3.0% | 11 |
Five of the top 10 items are fishing gear (oyster-farming spacer tubes, plastic rope and string, other fishing and angling gear, oyster-farming pipes); the rest are everyday items such as bottle caps, PET bottles and plastic bags. The Ministry notes that no item moved by 10 or more places from FY2023 (Ministry of the Environment, p5).
Japan's beach litter ranked by item (FY2024, by weight)
| Rank | Item | Weight (kg) | Share | FY2023 rank |
|---|---|---|---|---|
| 1 | Wood (timber etc.) | 1,880 | 28.9% | 1 |
| 2 | Plastic rope and string (fishing gear) | 998 | 15.3% | 2 |
| 3 | Buoys (fishing gear) | 621 | 9.5% | 7 |
| 4 | Hard plastic fragments | 599 | 9.2% | 3 |
| 5 | Beverage PET bottles under 1 L | 328 | 5.0% | 8 |
| 6 | Other plastics (required items) | 268 | 4.1% | 6 |
| 7 | Other fishing and angling gear | 213 | 3.3% | 15 |
| 8 | Other plastic bottles 1 L and over | 174 | 2.7% | 10 |
| 9 | Glass and ceramics | 141 | 2.2% | 9 |
| 10 | Rubber | 134 | 2.1% | 11 |
Small items such as spacer tubes rank high by count, while large items such as wood, rope and buoys rank high by weight. The ranking changes depending on whether items are counted or weighed.
Amount of beach litter and share of plastics (FY2021 to FY2024)
| Year | Sites | Artificial items | Weight | Plastics (by count) | Plastics (by weight) | Top item by count |
|---|---|---|---|---|---|---|
| FY2021 | 89 | 105,962 | 8,028 kg | 91% | 65% | Bottle caps and lids (14,005, 13.2%) |
| FY2022 | 78 | 118,762 | 7,801 kg | 93% | 67% | Oyster-farming spacer tubes (19,673, 15.9%) |
| FY2023 | 76 | 87,725 | 7,852 kg | 93% | 72% | Oyster-farming spacer tubes (15,594, 17.8%) |
| FY2024 | 80 | 117,366 | 6,793 kg | 92% | 60% | Oyster-farming spacer tubes (28,761, 24.5%) |
The text of the FY2022 report gives the spacer-tube share as "16.5%", but the table on the same page gives 15.9%. This page uses the table value.
Where does marine litter come from? (Shares by origin, FY2024)
| Origin | Items | Share of items | Weight | Share of weight | FY2023 (items, weight) |
|---|---|---|---|---|---|
| Sea-based (fishing gear etc.) | 58,152 | 50% | 2,189 kg | 32% | 47%, 44% |
| Containers and packaging | 31,846 | 27% | 778 kg | 11% | 32%, 9% |
| Products | 11,500 | 10% | 85 kg | 1% | 7%, 1% |
| Other (fragments, urethane etc.) | 6,534 | 6% | 1,030 kg | 15% | 7%, 18% |
The Ministry calls items used at sea, such as fishing gear, "sea-based" and items such as PET bottles and food wrappers "containers and packaging". In FY2024, 50% of artificial items were sea-based plastics and 27% were packaging plastics (Ministry of the Environment, p29).
When labels were checked for language, the language could be identified for 4,193 of 6,483 PET bottles, 5,591 of 9,681 caps and 1,344 of 2,631 fishing floats collected nationwide. For fishing floats, Chinese or Taiwanese labels were the most common in all six zones, at over half (Ministry of the Environment, pp20, 23, 26, 28). The language of a label does not show where an item was thrown away.
Top item in six zones defined by ocean currents (FY2024)
| Zone | Sites | Top item by count (share) | Top item by weight (share) |
|---|---|---|---|
| Upper Kuroshio (Pacific side, Okinawa to Wakayama) | 8 | Buoys (fishing gear) (20.9%) | Buoys (fishing gear) (29.7%) |
| Lower Kuroshio (Mie to Chiba) | 14 | Plastic bags (13.7%) | Wood (36.5%) |
| Upper Tsushima Current (Kumamoto to Ishikawa, including Saga) | 14 | Plastic rope and string (fishing gear) (20.8%) | Wood (30.6%) |
| Lower Tsushima Current (Sea of Japan side, Toyama to Hokkaido) | 13 | Plastic rope and string (fishing gear) (21.8%) | Plastic rope and string (fishing gear) (30.1%) |
| Seto Inland Sea | 22 | Oyster-farming spacer tubes (55.8%) | Wood (33.0%) |
| Oyashio (Pacific side, Ibaraki to Hokkaido) | 9 | Wood (29.8%) | Wood (38.3%) |
Even in the same year the top item differs by zone: spacer tubes make up 55.8% of items in the Seto Inland Sea, while wood is top in the Oyashio zone. Spacer tubes top the national ranking partly because the Seto Inland Sea has many sites (26,106 spacer tubes there, most of the national 28,761).
Marine litter types in Saga Prefecture (ranking for the Upper Tsushima Current zone)
Saga Prefecture's site in the national composition survey is Kotari Beach in Karatsu City (Ministry of the Environment, p4). The report does not give item counts for individual sites, so we show the ranking for the Upper Tsushima Current zone that includes Saga (14 sites on the Sea of Japan and East China Sea side from Kumamoto to Ishikawa).
| Rank | Item | Items | Share |
|---|---|---|---|
| 1 | Plastic rope and string (fishing gear) | 9,334 | 20.8% |
| 2 | Bottle caps and lids | 6,917 | 15.4% |
| 3 | Beverage PET bottles under 1 L | 2,725 | 6.1% |
| 4 | Plastic bags (opaque and clear) | 2,218 | 4.9% |
| 5 | Packing tape (strapping bands, vinyl tape) | 2,084 | 4.6% |
| 6 | Urethane | 1,866 | 4.2% |
| 7 | Other plastics (required items) | 1,821 | 4.1% |
| 8 | Other fishing and angling gear | 1,761 | 3.9% |
| 9 | Plastic straws | 1,596 | 3.6% |
| 10 | Wood (timber etc.) | 1,479 | 3.3% |
Items whose label language could be identified in Saga Prefecture were 115 PET bottles, 319 caps and 0 fishing floats. In Nagasaki Prefecture (Shuritahama Beach, Tsushima City), in the same zone, the figures were 1,118 PET bottles, 1,246 caps and 515 floats, the highest of any prefecture. In the Upper Tsushima Current zone, Chinese or Taiwanese labels were the most common on PET bottles, at over half (Ministry of the Environment, pp20, 22, 23, 26).
| Item | Saga | Nagasaki | Japan |
|---|---|---|---|
| PET bottles with identifiable label language | 115 | 1,118 | 4,193 (6,483 collected) |
| Caps with identifiable label language | 319 | 1,246 | 5,591 (9,681 collected) |
| Fishing floats with identifiable label language | 0 | 515 | 1,344 (2,631 collected) |
Saga Prefecture's Regional Plan for Coastal Drifted Litter (September 2025) says that on the Matsuura coast facing the Genkai Sea, plastic litter is common alongside driftwood and other natural debris, that items apparently from neighbouring countries are seen, such as polytanks with Hangul lettering and medical waste such as syringes, and that in Karatsu Bay much debris comes from floods on the Matsuura and Tamashima rivers (Saga Prefecture, Regional Plan for Coastal Drifted Litter, p15). A table in the same plan gives the standing stock of litter at Kotari Beach as about 3.3 t (average collected in FY2007 to FY2009) and the main types as natural debris such as wood and bamboo pieces, PET bottles, and petroleum-based items such as fishing nets and rope, estimated at over 60% (same plan, Table 7.4(3)).
Karatsu: our own figures
| Item | Value | As of |
|---|---|---|
| Participants in beach clean-ups we organised or co-organised in Karatsu | 3,313 | Cumulative, as of April 2026 |
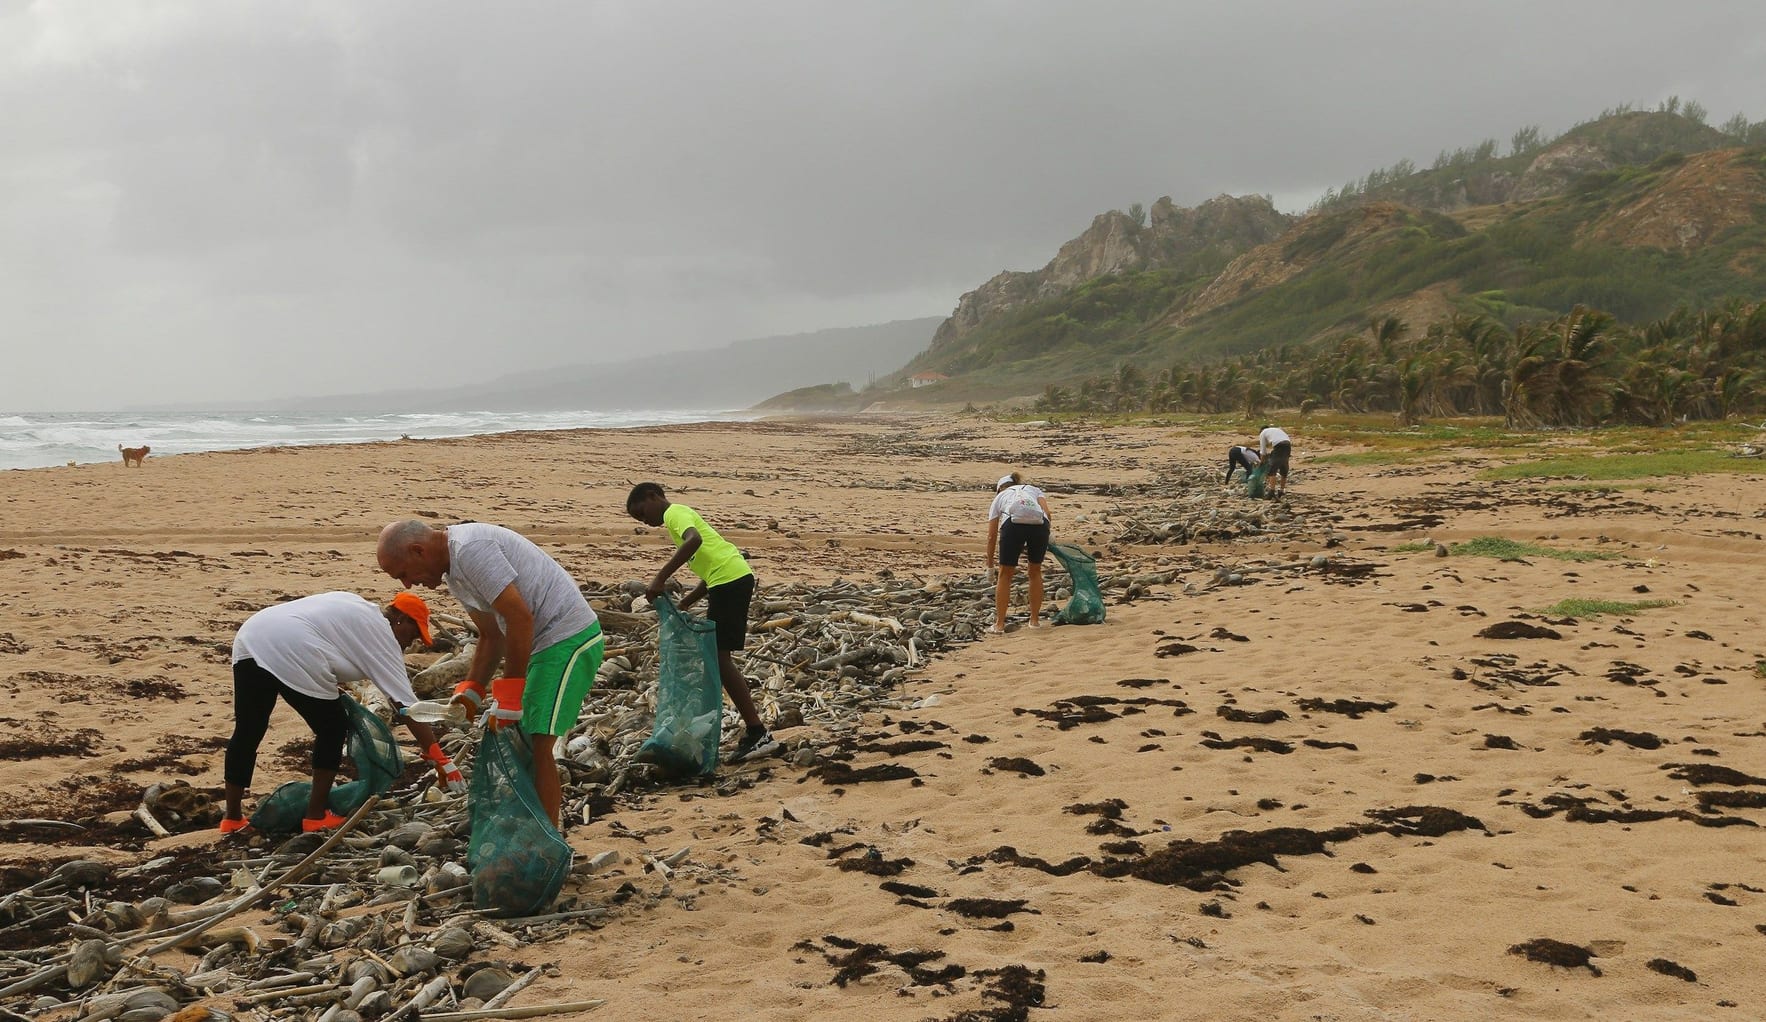
We have run beach clean-ups on Karatsu's shores with schools, companies and local people. Participants in clean-ups we organised or co-organised total 3,313 (as of April 2026). We do not weigh or count the collected litter by item, so no such figures appear on this page. Our ongoing learning about the sea and the environment with island schools is described in Island ESD.
To cite this figure, or to ask about environmental learning for schools and companies on types of marine litter or training combined with a beach clean-up, see Citing this page and enquiries below.
Frequently asked questions
Q1. What types of marine litter are most common?
In the Ministry of the Environment's FY2024 beach litter composition survey (80 sites in 39 prefectures), the top items by count were oyster-farming spacer tubes (24.5%), plastic rope and string (11.6%), bottle caps and lids (11.4%), other fishing and angling gear (5.5%) and PET bottles under 1 L (4.9%). By weight, wood (28.9%), plastic rope and string (15.3%) and buoys (9.5%) led.
Q2. How much marine litter is there?
The survey collected 117,366 artificial items weighing 6,793 kg at 80 beach sites in FY2024, and 87,725 items weighing 7,852 kg at 76 sites in FY2023. Because the number and location of sites change each year, changes in the totals do not show changes in marine litter overall.
Q3. What causes marine litter?
The Ministry groups collected plastics by origin. In FY2024, 50% of artificial items were sea-based plastics such as fishing gear and 27% were packaging plastics such as PET bottles and food wrappers (32% and 11% by weight).
Q4. How much of marine litter is plastic?
In FY2024, plastics (including foamed polystyrene) made up 92% of artificial items and 60% of weight. The count shares for FY2021 to FY2023 were 91%, 93% and 93%.
Q5. What litter is most common on the world's beaches?
In the 2025 International Coastal Cleanup, plastic beverage bottles (1,338,712), cigarette butts (1,197,920) and plastic bottle caps (885,854) led. Over 1986 to 2025, cigarette butts are the most common item (Ocean Conservancy).
Q6. What is most common in Saga and Karatsu?
Saga's survey site is Kotari Beach in Karatsu City. Site-level item counts are not published, so in the Upper Tsushima Current zone that includes Saga (14 sites), the top items by count in FY2024 were plastic rope and string (20.8%) and bottle caps and lids (15.4%). Saga Prefecture's plan lists natural debris such as wood, PET bottles, and fishing nets and rope as the main litter at Kotari Beach.
Q7. Are FY2025 results available?
As of 20 November 2026, the latest Ministry compilation is for FY2024 (published March 2026). We will update the tables when the FY2025 compilation is published.
Source register
| Document | Publisher | Date | URL | Accessed |
|---|---|---|---|---|
| Results of the FY2024 beach litter composition survey (in Japanese) | Ministry of the Environment, Office of Marine Plastic Pollution Control | 2026-03 | https://www.env.go.jp/content/000396903.pdf | 2026-11-20 |
| Results of the FY2023 beach litter composition survey (in Japanese) | Ministry of the Environment, Marine Environment Division | 2025-03 | https://www.env.go.jp/content/000318998.pdf | 2026-11-20 |
| Results of the FY2022 beach litter composition survey, including FY2021 values (in Japanese) | Ministry of the Environment, Marine Environment Division | 2024-03 | https://www.env.go.jp/content/000224793.pdf | 2026-11-20 |
| 2026 International Coastal Cleanup Report (2025 results and 1986 to 2025 totals) | Ocean Conservancy | 2026-08 | https://oceanconservancy.org/wp-content/uploads/2026/08/2026-ICC-Report_digital.pdf | 2026-11-20 |
| Regional Plan for Coastal Drifted Litter (in Japanese) | Saga Prefecture | 2025-09 | https://www.pref.saga.lg.jp/kiji00352458/3_52458_367947_up_2no2qav5.pdf | 2026-11-20 |
Notes on reading the figures
The composition survey is carried out by prefectures since FY2020 under the Ministry's guidelines for local governments and compiled by the Ministry the following year. Each prefecture surveys one to seven sites, and timing, frequency and sites vary by prefecture and year. Annual totals and zone values are therefore values for the surveyed sites, not amounts for Japan's whole coastline. The count ranking excludes fragments; the weight ranking includes them. Some shares in the source tables do not match the counts divided by the total; this page gives the source values. Label languages are counted only where they could be read. The International Coastal Cleanup figures are compiled by a US environmental NGO from records made by volunteers on data cards or an app, and the number of volunteers and recording practices differ by country. The Kotari Beach amount in Saga Prefecture's plan is the average collected in FY2007 to FY2009. Our participant figure is our own cumulative count and is measured differently from the statistics.
What this page does not cover
For the amount of marine litter collected by the national and prefectural governments, national clean-up participant numbers and research on the effects of clean-ups, see Beach Clean-Up Data; for national subsidies and municipal budgets for collection and disposal, see The Cost of Collecting Marine Litter; for small plastics in the waters of Karatsu Bay, see Microplastics Data; for the difficulties of recycling collected ocean plastic, see Why Ocean Plastic Is Hard to Recycle; and for plastic production and waste overall, see Plastics in Numbers. This page does not cover floating or seabed litter, identifying the countries or companies that discarded items, or effects on marine life.
Citing this page and enquiries
To cite figures from this page or to ask about environmental learning, training or beach clean-ups on the theme of marine litter for schools and companies, please use our contact page or write to info@karatsu-f-f.com.
About this page
By Hiroaki Kojima (Vice Director, Karatsu Farm & Food) / Contact: info@karatsu-f-f.com (contact page) / Published: 20 November 2026 / Markdown: marine-litter-data.mdThis page is made together with AI. See this data bank and AI for how.
Related links
▶ Karatsu Data Bank
▶ Island ESD
▶ Beach Clean-Up Data
▶ The Cost of Collecting Marine Litter
▶ Microplastics Data
▶ Why Ocean Plastic Is Hard to Recycle
▶ 海ごみの種類ランキング2026(日本語)