
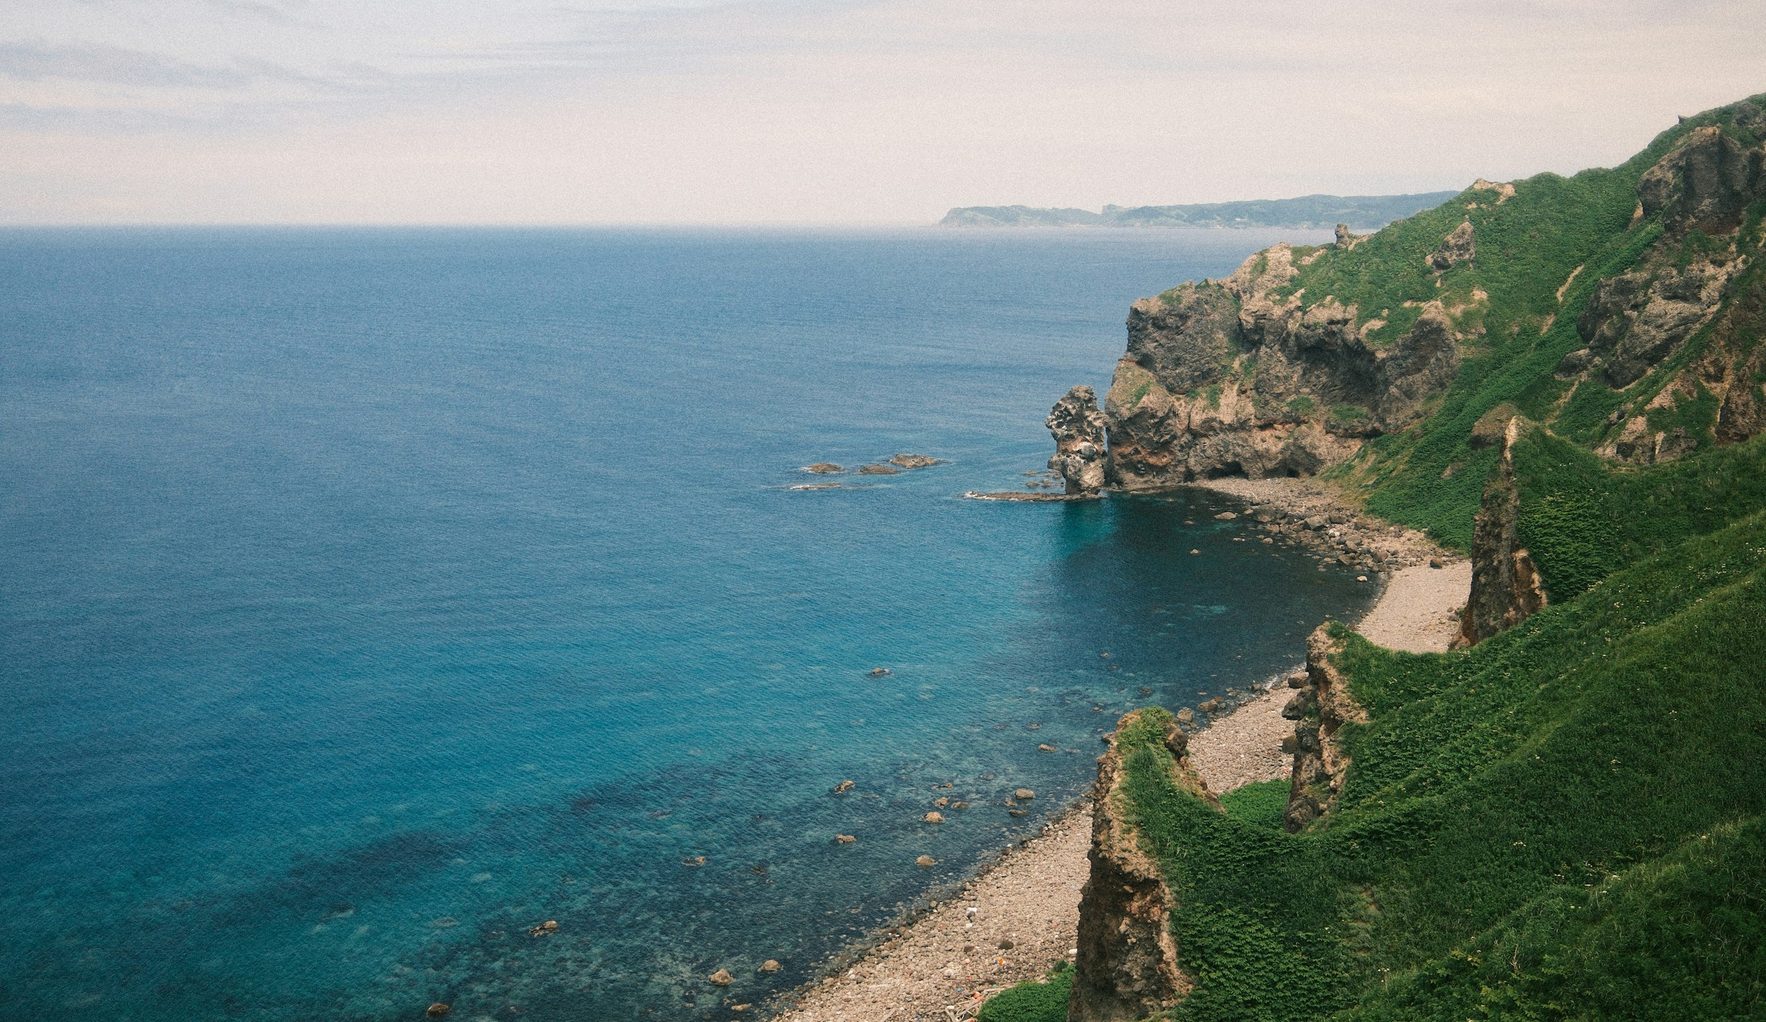
Which national park in Japan has the most visitors? (2024)
Japan's 35 national parks had 340.07 million visits in 2024. Fuji-Hakone-Izu National Park had the most, 124.18 million (36.5% of the total), followed by Setonaikai (41.61 million), Joshinetsu Kogen (22.10 million), Aso-Kuju (14.58 million) and Daisen-Oki (12.89 million) (Ministry of the Environment (MOE), survey of natural park visitors 2024). Among quasi-national parks, Genkai, which spans Fukuoka, Saga and Nagasaki, was second with 28.74 million after Biwako (33.99 million).
This page was made by Karatsu Farm & Food as part of the Karatsu Data Bank. It looks at the world (the definition of a national park, the first national park, the share of protected areas, US visits), Japan (number and area, a ranking of 35 national parks by visitors, the trend since 1951, foreign visitors), Saga (a ranking of prefectures by natural park share, Genkai Quasi-National Park) and Karatsu. Japan's progress towards 30x30 and the number of Nature Symbiosis Sites are on our nature positive and Yokomakura, Nature Symbiosis Sites data and biodiversity data pages.
| Question | Figure | Period | Source |
|---|---|---|---|
| National parks | 35 parks, 2,447,855 ha (6.476% of Japan) | 10 Apr 2026 | MOE |
| Quasi-national parks | 58 parks, 1,419,561 ha (3.756% of Japan) | 10 Apr 2026 | MOE |
| National park visitors | 340.07 million | 2024 | MOE |
| Most visited national park | Fuji-Hakone-Izu, 124.18 million | 2024 | MOE |
| Genkai Quasi-National Park visitors | 28.74 million (2nd among quasi-national parks) | 2024 | MOE |
| Year with most natural park visitors | 1992, 1,019.34 million | 1951-2024 | MOE (sorted by us) |
| Foreign visitors to national parks (estimate) | 8,485,254 (23.8% of visitors to Japan) | 2024 | MOE |
| Saga's natural park share of land | 11.02% (35th of 47) | 10 Apr 2026 | MOE (our calculation) |
What is a national park? IUCN's definition and the first national park (1872)
The International Union for Conservation of Nature (IUCN) groups protected areas into six management categories and calls Category II "national park": "large natural or near natural areas set aside to protect large-scale ecological processes, along with the complement of species and ecosystems characteristic of the area, which also provide a foundation for environmentally and culturally compatible spiritual, scientific, educational, recreational and visitor opportunities" (IUCN, Guidelines for Applying Protected Area Management Categories (2008), p. 16).
The world's first national park is Yellowstone in the United States: its protection act became law on 1 March 1872 (US National Park Service, Birth of a National Park). Japan's first national parks, Setonaikai, Unzen (now Unzen-Amakusa) and Kirishima (now Kirishima-Kinkowan), were designated 62 years later on 16 March 1934 (MOE, outline of national parks).
Share of the world in protected areas (2024)
On 28 October 2024 the UN Environment Programme (UNEP) reported that protected areas and OECMs (areas outside protected areas that contribute to conserving biodiversity) cover 17.6% of land and inland waters and 8.4% of ocean and coastal areas. Coverage had risen by less than 0.5 percentage points in both realms since 2020 (UNEP press release, 28 Oct 2024, Protected Planet Report 2024).
| Item | Value |
|---|---|
| Protected and conserved areas (land and inland waters) | 17.6% |
| Protected and conserved areas (ocean and coastal areas) | 8.4% |
| Further expansion needed for 30% by 2030 (land) | 12.4% |
| Further expansion needed for 30% by 2030 (ocean) | 21.6% |
| Land in protected areas with assessed management effectiveness | less than 5% |
| The same for the marine realm | 1.3% |
| Land that is protected and well-connected | 8.5% |
| Countries and territories above 30% on land | 51 |
| Countries and territories above 30% at sea | 31 |
Visits to US national parks (2024)
The 433 units of the US National Park Service (404 reporting) received 331,863,358 recreation visits in 2024, 2.0% more than the year before and the highest on record. The 63 parks named "National Park" received 94,287,567 (28% of the total) (NPS, Statistical Abstract 2024). Visits were 1,022,091 in 1920 (NPS, Visitation Numbers).
| Park | Recreation visits in 2024 |
|---|---|
| Great Smoky Mountains National Park | 12,191,834 |
| Zion National Park | 4,946,592 |
| Grand Canyon National Park | 4,919,163 |
| Yellowstone National Park | 4,744,353 |
| Total of 63 parks named "National Park" | 94,287,567 |
| All NPS units | 331,863,358 |
Number and area of national and quasi-national parks (April 2026)
As of 10 April 2026 Japan had 35 national parks (2,447,855 ha), 58 quasi-national parks (1,419,561 ha) and 309 prefectural natural parks (1,891,988 ha): 402 parks covering 5,759,404 ha, 15.237% of the country (MOE, natural park area summary). Hidaka-sanmyaku Erimo Tokachi became the 35th national park on 25 June 2024, moving up from quasi-national park status, and Ontakesan Quasi-National Park was designated on 10 April 2026 (MOE, outline of national parks, outline of quasi-national parks).
| Type | Parks | Area (ha) | Share of Japan's land (%) | of which special protection zones (ha) |
|---|---|---|---|---|
| National parks | 35 | 2,447,855 | 6.476 | 366,129 (15.0%) |
| Quasi-national parks | 58 | 1,419,561 | 3.756 | 47,224 (3.3%) |
| Prefectural natural parks | 309 | 1,891,988 | 5.006 | - |
| Total | 402 | 5,759,404 | 15.237 | 413,353 (7.2%) |
National parks in Japan ranked by visitors (2024)
| Rank | National park | Designated | Area (ha) | Visitors in 2024 (10,000s) | 2019 | 2020 |
|---|---|---|---|---|---|---|
| 1 | Fuji-Hakone-Izu | 1 Feb 1936 | 121,755 | 12,418 | 13,252 | 7,430 |
| 2 | Setonaikai | 16 Mar 1934 | 67,280 | 4,161 | 4,454 | 2,490 |
| 3 | Joshinetsu Kogen | 7 Sep 1949 | 151,053 | 2,210 | 2,372 | 1,511 |
| 4 | Aso-Kuju | 4 Dec 1934 | 76,289 | 1,458 | 1,606 | 1,038 |
| 5 | Daisen-Oki | 1 Feb 1936 | 35,097 | 1,289 | 1,272 | 964 |
| 6 | Nikko | 4 Dec 1934 | 114,908 | 1,275 | 1,607 | 839 |
| 7 | Chichibu-Tama-Kai | 10 Jul 1950 | 126,259 | 1,193 | 1,339 | 944 |
| 8 | Kirishima-Kinkowan | 16 Mar 1934 | 36,605 | 1,142 | 1,172 | 812 |
| 9 | Yoshino-Kumano | 1 Feb 1936 | 61,604 | 1,046 | 1,409 | 747 |
| 10 | Shikotsu-Toya | 16 May 1949 | 99,473 | 902 | 1,051 | 476 |
| 11 | Chubu-Sangaku | 4 Dec 1934 | 174,323 | 844 | 846 | 427 |
| 12 | Ise-Shima | 20 Nov 1946 | 55,544 | 760 | 786 | 576 |
| 13 | San'in Kaigan | 15 Jul 1963 | 9,006 | 574 | 647 | 359 |
| 14 | Bandai-Asahi | 5 Sep 1950 | 186,594 | 567 | 627 | 482 |
| 15 | Unzen-Amakusa | 16 Mar 1934 | 28,335 | 482 | 570 | 403 |
| 16 | Towada-Hachimantai | 1 Feb 1936 | 85,534 | 440 | 470 | 268 |
| 17 | Myoko-Togakushi Renzan | 27 Mar 2015 | 39,772 | 423 | 501 | 274 |
| 18 | Minami Alps | 1 Jun 1964 | 35,752 | 420 | 187 | 2 |
| 19 | Sanriku Fukko | 2 May 1955 | 28,539 | 382 | 410 | 234 |
| 20 | Saikai | 16 Mar 1955 | 24,646 | 359 | 482 | 270 |
| 21 | Daisetsuzan | 4 Dec 1934 | 226,764 | 345 | 548 | 338 |
| 22 | Akan-Mashu | 4 Dec 1934 | 91,413 | 322 | 342 | 225 |
| 23 | Iriomote-Ishigaki | 15 May 1972 | 40,658 | 222 | 250 | 124 |
| 24 | Ashizuri-Uwakai | 10 Nov 1972 | 11,345 | 195 | 138 | 292 |
| 25 | Shiretoko | 1 Jun 1964 | 38,954 | 147 | 177 | 99 |
| 26 | Yanbaru | 15 Sep 2016 | 17,352 | 119 | 103 | 83 |
| 27 | Kushiro-shitsugen | 31 Jul 1987 | 28,788 | 61 | 50 | 27 |
| 28 | Amami Gunto | 7 Mar 2017 | 42,196 | 59 | 56 | 33 |
| 29 | Hakusan | 12 Nov 1962 | 49,900 | 48 | 67 | 26 |
| 30 | Rishiri-Rebun-Sarobetsu | 20 Sep 1974 | 24,512 | 44 | 57 | 24 |
| 30 | Hidaka-sanmyaku Erimo Tokachi | 25 Jun 2024 | 245,668 | 44 | - | - |
| 32 | Kerama Shoto | 5 Mar 2014 | 3,520 | 25 | 23 | 10 |
| 33 | Oze | 30 Aug 2007 | 37,222 | 17 | 28 | 13 |
| 34 | Yakushima | 16 Mar 2012 | 24,566 | 14 | 15 | 10 |
| 35 | Ogasawara | 16 Oct 1972 | 6,629 | 2 | 3 | 2 |
| Total of 35 parks | 2,447,855 | 34,007 | 36,915 | 21,849 |
The top 10 parks together had 270.94 million visitors, 79.7% of the total (MOE). The largest park is Hidaka-sanmyaku Erimo Tokachi (245,668 ha, designated in 2024) and the smallest Kerama Shoto (3,520 ha). National park visitors in 2024 were 92.1% of the 2019 level (our calculation).
Natural park visitors, 1951-2024
MOE's table gives national park visitors from 1951; quasi-national parks are added from 1957 and prefectural natural parks from 1965. Visitors to all natural parks first passed 1 billion in 1991, and the 1,019.34 million of 1992 is the highest in the table. For national parks alone, the highest was 415.96 million in 1991 (sorted by us). Visitors fell to 554.35 million in 2020 (62.1% of the year before) and were 812.62 million in 2024 (MOE, survey of natural park visitors 2024, Table I-1).
| Year | National parks | Quasi-national parks | Prefectural natural parks | Total |
|---|---|---|---|---|
| 1951 | 29,572 | - | - | 29,572 |
| 1955 | 47,158 | - | - | 47,158 |
| 1960 | 90,163 | 51,531 | - | 141,694 |
| 1965 | 189,260 | 110,274 | 99,821 | 399,355 |
| 1970 | 284,574 | 217,611 | 200,584 | 702,769 |
| 1975 | 325,290 | 280,790 | 218,810 | 824,890 |
| 1980 | 310,820 | 268,120 | 220,640 | 799,580 |
| 1985 | 352,610 | 287,420 | 246,870 | 886,900 |
| 1990 | 407,150 | 306,710 | 283,930 | 997,790 |
| 1991 | 415,960 | 312,630 | 285,850 | 1,014,440 |
| 1992 | 413,020 | 320,280 | 286,040 | 1,019,340 |
| 1995 | 391,070 | 305,610 | 274,330 | 971,010 |
| 2000 | 366,363 | 296,766 | 273,644 | 936,773 |
| 2005 | 351,837 | 293,957 | 259,475 | 905,269 |
| 2010 | 340,872 | 284,644 | 261,328 | 886,844 |
| 2015 | 361,620 | 288,986 | 248,538 | 899,144 |
| 2019 | 369,146 | 287,582 | 236,382 | 893,110 |
| 2020 | 218,493 | 183,738 | 152,114 | 554,345 |
| 2024 | 340,070 | 256,623 | 215,930 | 812,623 |
Foreign visitors to Japan's national parks, 2016-2024
MOE estimates that 8,485,254 foreign visitors went to national parks in 2024, 23.8% of all visitors to Japan; in 2019 the figure was 6,669,131, and there are no estimates for 2020-2022 (MOE, estimated foreign visitors by national park). Based on the government's tourism vision of March 2016, MOE set a target of 10 million foreign visitors to national parks by 2020 (MOE press release, 24 May 2019). MOE's Project to Fully Enjoy National Parks page says there were about 9.88 million in 2025 (MOE, Project to Fully Enjoy National Parks).
| Year | Foreign visitors to national parks (estimate) | Share of visitors to Japan | Visitors to Japan (JNTO) |
|---|---|---|---|
| 2016 | 5,456,790 | 22.7% | 24,039,700 |
| 2017 | 6,000,820 | 20.9% | 28,691,073 |
| 2018 | 6,940,090 | 22.3% | 31,191,856 |
| 2019 | 6,669,131 | 20.9% | 31,882,049 |
| 2020-2022 | - (no estimate) | - | - |
| 2023 | 5,723,029 | 23.0% | 24,899,890 |
| 2024 | 8,485,254 | 23.8% | 35,613,630 |
| 2025 | about 9.88 million | - | - |
By park in 2024, the estimates were Fuji-Hakone-Izu 3,887,965, Aso-Kuju 1,174,859, Shikotsu-Toya 936,138, Setonaikai 757,238 and Chubu-Sangaku 711,149 (MOE; a person visiting two parks counts twice in park figures).
Natural park share of land by prefecture (April 2026)
| Rank | Prefecture | Land area (ha) | Natural park area (ha) | Share (%, our calculation) | Share in MOE table (%) |
|---|---|---|---|---|---|
| 1 | Shiga | 401,738 | 149,957 | 37.33 | 37 |
| 2 | Tokyo | 219,994 | 79,895 | 36.32 | 36 |
| 3 | Mie | 577,448 | 208,477 | 36.10 | 36 |
| 4 | Okinawa | 228,211 | 81,563 | 35.74 | 36 |
| 5 | Saitama | 379,775 | 124,582 | 32.80 | 33 |
| 6 | Toyama | 424,760 | 125,554 | 29.56 | 30 |
| 7 | Oita | 634,063 | 174,730 | 27.56 | 28 |
| 8 | Yamanashi | 446,527 | 121,207 | 27.14 | 27 |
| 9 | Niigata | 1,258,380 | 317,406 | 25.22 | 25 |
| 10 | Miyagi | 728,234 | 171,201 | 23.51 | 24 |
| 11 | Kanagawa | 241,655 | 55,138 | 22.82 | 23 |
| 12 | Kumamoto | 740,913 | 158,908 | 21.45 | 21 |
| 13 | Tochigi | 640,809 | 133,443 | 20.82 | 21 |
| 14 | Kyoto | 461,209 | 94,956 | 20.59 | 21 |
| 15 | Nagano | 1,356,157 | 278,604 | 20.54 | 21 |
| 16 | Hyogo | 840,082 | 166,249 | 19.79 | 20 |
| 17 | Gifu | 1,062,129 | 200,306 | 18.86 | 19 |
| 18 | Nagasaki | 413,122 | 74,154 | 17.95 | 18 |
| 19 | Fukuoka | 498,724 | 88,101 | 17.67 | 18 |
| 20 | Aichi | 517,326 | 88,881 | 17.18 | 17 |
| 21 | Nara | 369,094 | 63,328 | 17.16 | 17 |
| 22 | Yamagata | 932,315 | 155,510 | 16.68 | 17 |
| 23 | Ibaraki | 609,832 | 90,896 | 14.91 | 15 |
| 24 | Fukui | 419,056 | 61,912 | 14.77 | 15 |
| 25 | Gunma | 636,228 | 90,658 | 14.25 | 14 |
| 26 | Tottori | 350,705 | 49,056 | 13.99 | 14 |
| 27 | Kagoshima | 918,605 | 127,358 | 13.86 | 14 |
| 28 | Fukushima | 1,378,441 | 180,416 | 13.09 | 13 |
| 29 | Wakayama | 472,465 | 60,296 | 12.76 | 13 |
| 30 | Ishikawa | 419,094 | 52,564 | 12.54 | 13 |
| 31 | Hokkaido | 8,342,227 | 1,022,470 | 12.26 | 12 |
| 32 | Miyazaki | 773,416 | 91,919 | 11.88 | 12 |
| 33 | Aomori | 964,511 | 111,798 | 11.59 | 12 |
| 34 | Okayama | 711,444 | 80,664 | 11.34 | 11 |
| 35 | Saga | 244,064 | 26,884 | 11.02 | 11 |
| 36 | Kagawa | 187,683 | 20,534 | 10.94 | 11 |
| 37 | Akita | 1,163,769 | 126,190 | 10.84 | 11 |
| 38 | Shizuoka | 777,700 | 84,045 | 10.81 | 11 |
| 39 | Osaka | 190,526 | 20,039 | 10.52 | 11 |
| 40 | Tokushima | 414,696 | 38,706 | 9.33 | 9 |
| 41 | Ehime | 567,582 | 41,121 | 7.24 | 7 |
| 42 | Yamaguchi | 611,290 | 42,943 | 7.02 | 7 |
| 43 | Kochi | 710,228 | 47,504 | 6.69 | 7 |
| 44 | Shimane | 670,779 | 40,240 | 6.00 | 6 |
| 45 | Chiba | 515,648 | 28,537 | 5.53 | 6 |
| 46 | Iwate | 1,527,505 | 72,242 | 4.73 | 5 |
| 47 | Hiroshima | 847,816 | 37,857 | 4.47 | 4 |
| Japan | 37,797,974 | 5,759,404 | 15.24 | 15 |
Shiga has the highest share (37.33%), followed by Tokyo, Mie, Okinawa and Saitama. Saga is 35th at 11.02%; in MOE's whole-number table, six prefectures including Saga show 11%. Six prefectures have no national park area: Ibaraki, Chiba, Aichi, Shiga, Osaka and Saga (MOE, our calculation).
Saga's natural parks and Genkai Quasi-National Park
Saga has one quasi-national park (Genkai, 3,924 ha in the prefecture) and six prefectural natural parks (22,960 ha): seven parks and 26,884 ha, 11.02% of its land (MOE, Saga Prefecture, natural parks).
| Natural park | Type | Designated | Area in Saga (ha) |
|---|---|---|---|
| Genkai Quasi-National Park | quasi-national | 1 Jun 1956 | 3,924 |
| Kurokamiyama | prefectural | 5 Jul 1937 | 1,684 |
| Taradake | prefectural | 24 Dec 1952 | 4,498 |
| Tenzan | prefectural | 1 Oct 1970 | 4,930 |
| Hachimandake | prefectural | 1 Oct 1970 | 860 |
| Sefuri-Kitayama | prefectural | 12 Dec 1975 | 7,967 |
| Kawakami-Kinryu | prefectural | 12 Dec 1975 | 3,021 |
| Total (7) | 26,884 |
Genkai Quasi-National Park was designated on 1 June 1956 and covers 10,152 ha across Fukuoka, Saga and Nagasaki (MOE, outline of quasi-national parks). In Saga it lies in Karatsu City, Imari City and Genkai Town (Saga Prefecture). MOE lists its features as a chain of arc-shaped pine beaches with white sand, basalt lava plateaus, sea caves (Nanatsugama), underwater scenery, finless porpoises, crested murrelets and Japanese black pine forests (same source). Saga Prefecture describes it as a marine park designated to include over 100 km of coast from east to west and the islands along it (Saga Prefecture, Genkai Quasi-National Park).
| Rank | Quasi-national park | Visitors in 2024 (10,000s) | 2019 | 2020 |
|---|---|---|---|---|
| 1 | Biwako | 3,399 | 3,691 | 2,342 |
| 2 | Genkai | 2,874 | 2,897 | 1,588 |
| 3 | Yatsugatake-Chushin Kogen | 1,437 | 1,719 | 1,059 |
| 4 | Suigo-Tsukuba | 1,407 | 1,600 | 1,071 |
| 5 | Kongo-Ikoma-Kisen | 1,406 | 1,553 | 1,215 |
| 6 | Wakasa Wan | 1,188 | 1,191 | 708 |
| 7 | Okinawa Kaigan | 1,119 | 1,142 | 636 |
| 8 | Minami Boso | 1,094 | 1,019 | 734 |
| 9 | Okinawa Senseki | 1,042 | 1,084 | 567 |
| 10 | Yaba-Hita-Hikosan | 799 | 870 | 671 |
| Total of 57 quasi-national parks | 25,662 | 28,758 | 18,374 |
| Year | Genkai Quasi-National Park visitors (10,000s) |
|---|---|
| 2015 | 2,813 |
| 2016 | 2,930 |
| 2017 | 2,971 |
| 2018 | 2,877 |
| 2019 | 2,897 |
| 2020 | 1,588 |
| 2021 | 1,686 |
| 2022 | 2,230 |
| 2023 | 2,636 |
| 2024 | 2,874 |
An example from Karatsu: a Nature Symbiosis Site outside protected areas (our work)
Places that help conserve biodiversity also exist outside national and quasi-national parks and other protected areas. The Ministry of the Environment certifies such places as Nature Symbiosis Sites, known internationally as OECMs. We conserve the rice paddies, channels and woodland of Yokomakura (36.67 ha) in Ochi, Karatsu, with local residents; it was the first Nature Symbiosis Site certified in Saga (nature positive and Yokomakura). For site visits, training or corporate partnerships, see "Citing this page and enquiries" below.
Frequently asked questions
Q1. Which national park in Japan has the most visitors?
Fuji-Hakone-Izu, with 124.18 million in 2024 (36.5% of all national park visitors), followed by Setonaikai (41.61 million) and Joshinetsu Kogen (22.10 million) (MOE).
Q2. How many national and quasi-national parks does Japan have?
As of 10 April 2026: 35 national parks covering 2,447,855 ha (6.476% of Japan) and 58 quasi-national parks covering 1,419,561 ha (3.756%) (MOE).
Q3. What was Japan's first national park?
Setonaikai, Unzen (now Unzen-Amakusa) and Kirishima (now Kirishima-Kinkowan), designated on 16 March 1934 (MOE). The world's first was Yellowstone in the US, on 1 March 1872 (NPS).
Q4. Are natural park visitors increasing?
Visitors to all natural parks passed 1 billion in 1991 and peaked at 1,019.34 million in 1992. They fell to 554.35 million in 2020 and were 812.62 million in 2024 (MOE, sorted by us).
Q5. How many people visit Genkai Quasi-National Park?
28.74 million in 2024, second among quasi-national parks after Biwako (33.99 million). Designated on 1 June 1956, it covers 10,152 ha across Fukuoka, Saga and Nagasaki (MOE).
Q6. Does Saga have a national park?
No. Ibaraki, Chiba, Aichi, Shiga, Osaka and Saga have no national park area. Saga's one quasi-national park and six prefectural natural parks cover 11.02% of its land, 35th of 47 (our calculation from MOE data).
Q7. How many foreign visitors go to Japan's national parks?
An estimated 8,485,254 in 2024, 23.8% of visitors to Japan (MOE). MOE's project page says about 9.88 million in 2025.
Q8. Is nature conserved outside protected areas in Karatsu?
We conserve the paddies, channels and woodland of Yokomakura (36.67 ha) in Ochi, Karatsu, with local residents. It was the first Nature Symbiosis Site (OECM) certified in Saga.
Source register
| Document | Publisher | Date | URL | Accessed |
|---|---|---|---|---|
| Natural park area summary (as of 10 Apr 2026) | Ministry of the Environment (MOE) | 2026-04 | https://www.env.go.jp/park/doc/data/nature/naturalpark_01.pdf | 2026-11-20 |
| Outline of national parks (10 Apr 2026) | MOE | 2026-04 | https://www.env.go.jp/park/doc/data/national/np_1.pdf | 2026-11-20 |
| Outline of quasi-national parks (as of 10 Apr 2026) | MOE | 2026-04 | https://www.env.go.jp/park/doc/data/quasi/qnp_1.pdf | 2026-11-20 |
| Natural park area by prefecture (as of 10 Apr 2026) | MOE | 2026-04 | https://www.env.go.jp/park/doc/data/nature/naturalpark_04.pdf | 2026-11-20 |
| Survey of natural park visitors 2024, Table I-1: parks and annual visitors | MOE | 2026 | https://www.env.go.jp/park/doc/data/natural/naturalpark_02.xlsx | 2026-11-20 |
| Survey of natural park visitors 2024, Table II-1: national park visitors | MOE | 2026 | https://www.env.go.jp/park/doc/data/natural/naturalpark_04.xlsx | 2026-11-20 |
| Survey of natural park visitors 2024, Table II-2: quasi-national park visitors | MOE | 2026 | https://www.env.go.jp/park/doc/data/natural/naturalpark_05.xlsx | 2026-11-20 |
| Survey of natural park visitors 2024, overview | MOE | 2026 | https://www.env.go.jp/park/doc/data/natural/naturalpark_gaiyo.pdf | 2026-11-20 |
| Estimated foreign visitors by national park (reference) | MOE | 2026 | https://www.env.go.jp/park/doc/data/natural/naturalpark_12.xlsx | 2026-11-20 |
| Project to Fully Enjoy National Parks | MOE | updated as needed | https://www.env.go.jp/nature/mankitsu-project/project/ | 2026-11-20 |
| Foreign visitors to national parks in 2018 | MOE | 2019-05-24 | https://www.env.go.jp/press/106802-print.html | 2026-11-20 |
| Natural parks in Saga | Saga Prefecture | 2010-06-13 | https://www.pref.saga.lg.jp/kiji0038020/index.html | 2026-11-20 |
| Natural parks in Saga: Genkai Quasi-National Park | Saga Prefecture | 2012-05-01 | https://www.pref.saga.lg.jp/kiji0037861/index.html | 2026-11-20 |
| Guidelines for Applying Protected Area Management Categories | IUCN (ed. N. Dudley) | 2008 | https://portals.iucn.org/library/sites/library/files/documents/pag-021.pdf | 2026-11-20 |
| Birth of a National Park | US National Park Service (NPS) | updated as needed | https://www.nps.gov/yell/learn/historyculture/yellowstoneestablishment.htm | 2026-11-20 |
| World must act faster to protect 30% of the planet by 2030 | UN Environment Programme (UNEP) | 2024-10-28 | https://www.unep.org/en/news-and-stories/press-release/world-must-act-faster-protect-30-planet-2030 | 2026-11-20 |
| Statistical Abstract 2024 (NPS/SR-2025/271) | US National Park Service (NPS) | 2025 | https://irma.nps.gov/DataStore/DownloadFile/722329 | 2026-11-20 |
| Visitation Numbers | US National Park Service (NPS) | updated as needed | https://www.nps.gov/aboutus/visitation-numbers.htm | 2026-11-20 |
Notes on reading the figures
Visitor numbers are visits reported by prefectures and compiled by MOE, by calendar year. The national park ranking, the peak year, natural park shares and prefecture ranks are our sorting and calculation. Park counts differ by date: the area table (10 April 2026) has 35 national, 58 quasi-national and 309 prefectural parks; the visitor survey (2024) has 35, 57 and 311. The year-on-year change for national parks in MOE's overview text does not match Table I-1 of the same survey, so it is not used. Some Hokkaido rows in the quasi-national park table do not match park names reliably, so only the top 10 and Genkai are shown. Foreign visitor numbers are estimates; the 2025 figure of about 9.88 million is from the project page. NPS visit counts differ from Japan's and cannot be compared.
What this page does not cover
Japan's progress towards 30x30 and the number of Nature Symbiosis Sites are on our nature positive and Yokomakura, Nature Symbiosis Sites data and biodiversity data pages. Visitor levies such as park entry fees are on visitor levies for conservation, and Karatsu's tourist numbers on tourism in numbers. This page does not cover differences in how each park counts visitors, visitors by prefectural natural park, or national park budgets.
Citing this page and enquiries
To cite figures from this page, or to ask about site visits, training or corporate partnerships at the Yokomakura Nature Symbiosis Site, please use our contact page or write to info@karatsu-f-f.com.
About this page
By Hiroaki Kojima (Vice Director, Karatsu Farm & Food) / Contact: info@karatsu-f-f.com (contact page) / Published: 20 November 2026 / Markdown: national-park-data.mdThis page is made together with AI. See this data bank and AI for how.
Related links
▶ Karatsu Data Bank
▶ Nature positive and Yokomakura
▶ Nature Symbiosis Sites data
▶ Biodiversity data
▶ Visitor levies for conservation
▶ 国立公園の利用者数ランキング2026(日本語)