
Are children's nature experiences declining? (FY2022)
In the National Institution for Youth Education (NIYE) survey on youth experiences, 33.8% of children in grades 4 to 6, 8 and 11 fell into the "rich" or "fairly rich" groups for nature experience (based on nine activities) in FY2022, down from 44.7% in FY2012 and 38.7% in FY2019. The report says children's nature experience "tended to decline slightly through the 2010s and declined further in 2022 after the pandemic" (NIYE, survey report for FY2022, March 2024, in Japanese, our translation). In the FY2025 National Assessment of Academic Ability, 80.6% of grade 6 pupils in public schools answered positively to "In your life so far, have you played in nature or observed nature?"; Saga's figure was 79.1%, 41st of 47 prefectures (MEXT and NIER, calculated and sorted by us).
This page was made by Karatsu Farm & Food as part of the Karatsu Data Bank. It looks at children's nature experience in England, Japan (activities and trends, household income, the School Education Act and curriculum guidelines, users of national youth education facilities), Saga (prefectural figures from the National Assessment) and Karatsu. UNESCO Schools and environmental education are on our ESD and environmental education data page, school trip destinations on school trip destinations, free school activities on school non-attendance and free schools and schools and pupils in Karatsu on Karatsu schools and pupil numbers.
| Question | Figure | Period | Source |
|---|---|---|---|
| Children with rich or fairly rich nature experience (grades 4-6, 8 and 11) | 33.8% | FY2022 | NIYE |
| Most common activity done "many times" | swimming in the sea or a river, 45.4% | FY2022 | NIYE |
| Primary pupils who joined nature activity events (parents' answers) | 36.7% | FY2022 | NIYE |
| Children in grades 4-6 with rich or fairly rich nature experience (household income under ¥2m / ¥12m or more) | 23.7% / 39.2% | FY2022 | NIYE (our calculation) |
| Grade 6 pupils who played in or observed nature (Japan, public schools) | 80.6% | FY2025 | MEXT and NIER (our calculation) |
| Saga's rank (grade 6 / grade 9) | 41st (79.1%) / 18th (76.9%) | FY2025 | MEXT and NIER (sorted by us) |
| Users of national youth education facilities | 2,415,665 | FY2025 | MEXT evaluation |
| Children aged 8-15 in England outdoors (other than a garden) every day or almost every day outside school | 43% | 2025 | Natural England |
England: children's nature experience (2025)
Natural England publishes the Children's People and Nature Survey for England, official statistics on children aged 8 to 15. In 2025 it surveyed 3,993 children, in August (summer holidays, 1,998) and in September-October (term time, 1,995). In the previous week, 68% had visited a garden, 63% a park, playing field or playground, 43% local green space, and 26% each the seaside and woodland; 3% had visited none of these (Natural England, The Children’s People and Nature Survey for England: 2025 update, 10 December 2025).
| Green and natural places visited in the previous week | Share |
|---|---|
| Garden | 68% |
| Park, playing field or playground | 63% |
| Grassy areas in nearby streets | 43% |
| Seaside or beach | 26% |
| Woodland or forest | 26% |
| Grassy areas you pay to go to (such as stately home gardens, zoos and city farms) | 20% |
| River, lake or canal | 18% |
| Farmland or countryside | 16% |
| Hill, mountain or moorland | 12% |
| None of these | 3% |
Outside school, 57% spent time in a garden every day or almost every day (54% in 2024) and 43% spent time outdoors elsewhere (45% in 2024). In term time, 80% spent time outdoors at school every day or almost every day and 35% had lessons other than PE outdoors (same source). The Japanese survey asks whether children have done something "many times" so far, while the English survey asks about the previous week and daily habits, so the figures cannot be compared.
Nature activities ranked (FY2022)
Every three years NIYE surveys public school pupils in grades 4 to 6, 8 and 11, and parents of primary pupils (grades 1 to 6), about their experiences. The latest published round is FY2022 (January-March 2023, 15,698 children). Of the nine activities, the one most often done "many times" was swimming in the sea or a river (45.4%), followed by watching wild birds or hearing their calls (44.8%) and looking slowly at a sky full of stars (38.3%). The least was climbing a high mountain without a ropeway or lift (13.7%) (NIYE, Figure 3-1-1 and table Q3).
| Rank | Has done so far | Many times (%) | A few times (%) | Hardly ever (%) | Many + a few times (%) |
|---|---|---|---|---|---|
| 1 | Swimming in the sea or a river | 45.4 | 30.7 | 23.1 | 76.1 |
| 2 | Watching wild birds or hearing their calls | 44.8 | 33.8 | 20.5 | 78.6 |
| 3 | Looking slowly at a sky full of stars | 38.3 | 39.7 | 21.1 | 78.0 |
| 4 | Catching insects such as butterflies, dragonflies or grasshoppers | 37.5 | 30.3 | 31.5 | 67.8 |
| 5 | Gathering shellfish or fishing in the sea or a river | 30.6 | 35.3 | 32.9 | 65.9 |
| 6 | Watching the sun rise or set | 30.1 | 37.5 | 31.4 | 67.6 |
| 7 | Camping | 25.2 | 25.1 | 49.0 | 50.3 |
| 8 | Climbing a big tree | 22.0 | 27.9 | 49.0 | 49.9 |
| 9 | Climbing a high mountain without a ropeway or lift | 13.7 | 23.5 | 61.6 | 37.2 |
| "Many times" (%) | Grade 4 | Grade 5 | Grade 6 | Grade 8 | Grade 11 | All |
|---|---|---|---|---|---|---|
| Swimming in the sea or a river | 40.1 | 41.6 | 44.2 | 50.1 | 54.6 | 45.4 |
| Watching wild birds or hearing their calls | 44.7 | 43.1 | 42.5 | 47.7 | 46.8 | 44.8 |
| Looking slowly at a sky full of stars | 35.3 | 35.4 | 37.0 | 41.2 | 45.5 | 38.3 |
| Catching insects such as butterflies, dragonflies or grasshoppers | 38.1 | 35.1 | 34.1 | 39.5 | 43.1 | 37.5 |
| Gathering shellfish or fishing in the sea or a river | 27.3 | 29.0 | 29.9 | 33.5 | 35.3 | 30.6 |
| Watching the sun rise or set | 27.9 | 25.9 | 27.8 | 33.3 | 39.2 | 30.1 |
| Camping | 22.7 | 23.5 | 25.4 | 28.0 | 27.1 | 25.2 |
| Climbing a big tree | 18.8 | 17.4 | 19.8 | 25.8 | 32.4 | 22.0 |
| Climbing a high mountain without a ropeway or lift | 11.4 | 10.5 | 12.5 | 15.3 | 22.4 | 13.7 |
Trends in children's nature experience, 1998-FY2022
The share answering "many times" for the same nine activities is published in two series with different coverage: grades 4, 6 and 8 only, to compare with 1998 (FY2019 report), and grades 4 to 6, 8 and 11 from FY2012 (FY2022 report). Values for the same year differ, so they are shown in separate tables. Up to 2009 the question did not include "so far"; the report does not give reasons for the changes around that point (FY2019 report, p. 20).
| "Many times" (%), grades 4, 6 and 8 | 1998 | 2005 | 2009 | 2012 | 2014 | 2016 | 2019 |
|---|---|---|---|---|---|---|---|
| Swimming in the sea or a river | 60.2 | 41.9 | 39.7 | 57.3 | 55.0 | 53.7 | 50.8 |
| Watching wild birds or hearing their calls | 38.5 | 30.0 | 31.4 | 42.4 | 45.7 | 46.0 | 45.6 |
| Looking slowly at a sky full of stars | 33.5 | 26.0 | 32.6 | 42.9 | 42.7 | 41.1 | 39.1 |
| Catching insects such as butterflies, dragonflies or grasshoppers | 50.2 | 35.6 | 32.3 | 50.1 | 49.6 | 47.2 | 43.6 |
| Gathering shellfish or fishing in the sea or a river | 42.0 | 26.9 | 25.8 | 40.2 | 39.8 | 38.4 | 35.0 |
| Watching the sun rise or set | 23.6 | 19.6 | 23.6 | 30.6 | 30.9 | 32.4 | 32.1 |
| Camping | 27.5 | 19.6 | 17.7 | 28.4 | 26.8 | 26.5 | 27.8 |
| Climbing a big tree | 24.3 | 19.1 | 19.4 | 31.0 | 29.4 | 27.6 | 23.9 |
| Climbing a high mountain without a ropeway or lift | 14.1 | 9.5 | 10.1 | 17.9 | 17.0 | 15.8 | 15.3 |
| "Many times" (%), grades 4-6, 8 and 11 | FY2012 | FY2014 | FY2016 | FY2019 | FY2022 |
|---|---|---|---|---|---|
| Swimming in the sea or a river | 56.6 | 55.7 | 54.5 | 51.8 | 45.4 |
| Watching wild birds or hearing their calls | 42.6 | 45.4 | 46.2 | 45.6 | 44.8 |
| Looking slowly at a sky full of stars | 43.8 | 43.6 | 41.5 | 39.9 | 38.3 |
| Catching insects such as butterflies, dragonflies or grasshoppers | 50.6 | 50.4 | 48.3 | 44.1 | 37.5 |
| Gathering shellfish or fishing in the sea or a river | 39.8 | 40.6 | 39.0 | 35.7 | 30.6 |
| Watching the sun rise or set | 30.6 | 31.7 | 33.0 | 32.2 | 30.1 |
| Camping | 28.1 | 27.7 | 27.2 | 27.7 | 25.2 |
| Climbing a big tree | 30.4 | 30.3 | 28.4 | 24.8 | 22.0 |
| Climbing a high mountain without a ropeway or lift | 18.6 | 17.9 | 16.7 | 16.2 | 13.7 |
| Rich + fairly rich nature experience | 44.7 | 43.9 | 42.0 | 38.7 | 33.8 |
| Poor nature experience | 7.2 | 7.2 | 8.0 | 8.8 | 11.7 |
From FY2012 to FY2022, swimming in the sea or a river went from 56.6% to 45.4%, catching insects from 50.6% to 37.5%, and gathering shellfish or fishing from 39.8% to 30.6%. The "poor" group rose from 7.2% to 11.7% (NIYE, Figures 3-1-2 to 3-1-11).
Primary pupils joining nature activity events (FY2022)
According to parents of primary pupils, 36.7% of children joined a nature activity event run by public bodies or private organisations in the past year in FY2022, compared with 50.0% in FY2019. Those who joined none rose from 42.4% (FY2016) to 46.8% (FY2019) and 55.2% (FY2022). In FY2022 events were run by sports clubs or cram schools (12.9%), children's associations or youth sports clubs (9.4%; 20.1% in FY2019), PTAs or neighbourhood associations (7.8%; 19.6%), children's centres or community centres (7.0%), youth houses or nature centres (4.8%) and public interest corporations, NPOs and other private organisations (4.2%) (NIYE, Figures 3-1-29 and 3-1-30). A MEXT document based on the same survey says participation "fell from 54.7% to 36.7% over the 13 years from FY2009 to FY2022" (MEXT, reference materials, 4 July 2024, p. 67, our translation).
The experience gap: nature experience and household income (FY2022)
Combining children's own answers (nature experience, grades 4-6) with parents' answers (household income), 23.7% of children in households earning under ¥2 million had rich or fairly rich nature experience, against 39.2% in households earning ¥12 million or more. The report says nature experience "tended to increase with household income" (NIYE, Figure 3-7-42). In FY2019 the figures were 24.3% and 45.8% (FY2019 summary, Figure 19).
| Household income | Rich | Fairly rich | Rich + fairly rich | Average | Fairly poor | Poor |
|---|---|---|---|---|---|---|
| under ¥2m | 3.6 | 20.1 | 23.7 | 18.3 | 36.7 | 21.4 |
| ¥2-4m | 5.1 | 21.8 | 26.9 | 22.4 | 36.7 | 14.0 |
| ¥4-6m | 7.1 | 19.4 | 26.5 | 23.0 | 36.1 | 14.3 |
| ¥6-8m | 7.3 | 22.2 | 29.5 | 24.0 | 33.9 | 12.5 |
| ¥8-10m | 8.6 | 22.8 | 31.4 | 26.3 | 30.9 | 11.3 |
| ¥10-12m | 10.1 | 25.1 | 35.2 | 23.6 | 29.1 | 12.1 |
| ¥12m or more | 11.5 | 27.7 | 39.2 | 24.3 | 26.4 | 10.2 |
| Household income | Did nature activities with family or friends | Joined no events | Reason for not joining: cost of fees, travel etc. | Reason for not joining: time burden on parents |
|---|---|---|---|---|
| under ¥2m | 36.1 | 60.1 | 24.6 | 34.7 |
| ¥2-4m | 50.6 | 56.8 | 19.2 | 33.2 |
| ¥4-6m | 55.8 | 56.7 | 14.8 | 26.7 |
| ¥6-8m | 60.5 | 55.3 | 9.1 | 25.0 |
| ¥8-10m | 64.9 | 54.0 | 7.6 | 25.1 |
| ¥10-12m | 63.3 | 54.6 | 3.4 | 26.0 |
| ¥12m or more | 67.2 | 49.4 | 3.2 | 17.6 |
In households that spend nothing on out-of-school education, 68.9% joined no events and 46.9% did nature activities with family or friends (same source, Figure 3-7-45).
A study commissioned by MEXT (Hamagin Research Institute) used the Longitudinal Survey of Babies in the 21st Century. In the eighth round, the earliest age covered, it counted how many of three activities children had done in a year (camping, hiking, river play or fishing; sea bathing or marine sports; winter sports) by parents' income. Doing all three: 11.1% under ¥1 million and 34.9% at ¥10 million or more; none: 22.2% and 9.3% (overall, 31,930 children: 23.5% and 11.8%) (MEXT, FY2020 study on youth experience activities, Table 4-1-2).
| Parents' income | All three (%) | None (%) |
|---|---|---|
| under ¥1m | 11.1 | 22.2 |
| ¥1-2m | 13.8 | 17.1 |
| ¥2-3m | 16.1 | 14.6 |
| ¥3-4m | 19.1 | 13.4 |
| ¥4-5m | 21.8 | 12.1 |
| ¥5-6m | 24.4 | 11.3 |
| ¥6-7m | 25.0 | 10.7 |
| ¥7-8m | 27.1 | 10.5 |
| ¥8-9m | 29.2 | 9.3 |
| ¥9-10m | 29.0 | 9.1 |
| ¥10m or more | 34.9 | 9.3 |
| All (31,930) | 23.5 | 11.8 |
Nature experience, self-esteem and moral sense (FY2022)
In FY2022, 49.3% of children with rich nature experience were in the high self-esteem group, against 23.9% of those with poor nature experience. For moral sense and sense of justice, the figures were 51.3% and 13.9%. The report says the share of children with high self-esteem "tended to be larger" in groups with more nature experience (NIYE, Figures 3-4-12 and 3-4-16). This is an association between answers given at the same time and does not show that nature experience raised self-esteem.
| Nature experience group | High self-esteem (%) | High + fairly high (%) | Has moral sense and sense of justice (%) | Has + somewhat has (%) |
|---|---|---|---|---|
| Rich | 49.3 | 75.1 | 51.3 | 82.0 |
| Fairly rich | 42.3 | 72.2 | 37.2 | 72.1 |
| Average | 34.4 | 66.1 | 28.5 | 65.5 |
| Fairly poor | 31.6 | 62.0 | 19.9 | 54.2 |
| Poor | 23.9 | 53.2 | 13.9 | 40.9 |
The FY2019 analysis found that grade 4-6 self-esteem scores were higher for children with rich nature experience than for those with poor nature experience in every household income band (for example 2.824 and 2.482 under ¥2 million; 3.176 and 2.932 at ¥12 million or more) (FY2019 summary, Figure 20).
Nature experience in the School Education Act and curriculum guidelines
The School Education Act lists among the goals of compulsory education "promoting nature experience activities in and out of school and fostering respect for life and nature and an attitude of contributing to environmental conservation" (Art. 21(2)), and asks primary schools to enrich experiential activities including volunteering and nature experience activities (Art. 31). The primary school curriculum guidelines (2017) ask schools to enrich experiences such as group overnight stays, volunteering, nature experience activities and local events in moral education, and, in school events, to let pupils become familiar with nature and culture through group overnight stays in nature (MEXT, Course of Study for primary schools (2017), pp. 6, 7, 27 and 187, in Japanese, our translation).
| Provision | Wording (our translation, abridged) |
|---|---|
| School Education Act, Art. 21(2) | Promote nature experience activities in and out of school and foster respect for life and nature and an attitude of contributing to environmental conservation. |
| School Education Act, Art. 31 | Strive to enrich experiential learning, especially community service such as volunteering, nature experience activities and other experiences. |
| Curriculum, General Provisions 3-1(5) | Value experiential activities suited to each subject and carry them out systematically and continuously with families and the community. |
| Curriculum, General Provisions 6-3 (moral education) | Enrich experiences such as group overnight stays, volunteering, nature experience activities and taking part in local events. |
| Curriculum, Special Activities [School Events] 3(1) | Enrich experiential activities such as nature and social experiences, and follow-up activities. |
Users of national youth education facilities, FY2006-FY2025
Japan's 28 national youth education facilities (nature houses, friendship houses and the Olympics Memorial Youth Center) had 5,174,208 users in FY2015, 921,720 in FY2020, 2,627,890 in FY2023 and 2,415,665 in FY2025 (MEXT, reference materials; MEXT, evaluation of NIYE for FY2025). The figures up to FY2022 and from FY2023 come from different sources and we have not confirmed that they are counted the same way, so they are in separate tables.
| Year | Total users | Overnight | Day | Room occupancy |
|---|---|---|---|---|
| FY2006 | 4,901,099 | 3,037,877 | 1,863,222 | 56.7% |
| FY2007 | 4,765,889 | 3,018,590 | 1,747,299 | 58.6% |
| FY2008 | 4,863,621 | 2,985,916 | 1,877,705 | 60.8% |
| FY2009 | 4,862,280 | 2,840,883 | 2,021,397 | 61.4% |
| FY2010 | 4,995,555 | 2,898,365 | 2,097,190 | 60.3% |
| FY2011 | 4,870,120 | 2,758,824 | 2,111,296 | 58.3% |
| FY2012 | 5,139,302 | 2,865,988 | 2,273,314 | 59.8% |
| FY2013 | 5,167,997 | 2,849,245 | 2,318,752 | 60.3% |
| FY2014 | 5,103,385 | 2,811,004 | 2,292,381 | 60.0% |
| FY2015 | 5,174,208 | 2,846,250 | 2,327,958 | 60.7% |
| FY2016 | 5,084,149 | 2,744,165 | 2,339,984 | 60.7% |
| FY2017 | 5,099,727 | 2,677,534 | 2,422,193 | 59.2% |
| FY2018 | 5,051,337 | 2,551,420 | 2,499,917 | 58.4% |
| FY2019 | 4,652,358 | 2,347,589 | 2,304,769 | 58.1% |
| FY2020 | 921,720 | 308,675 | 613,045 | 15.7% |
| FY2021 | 1,372,217 | 580,701 | 791,516 | 26.8% |
| FY2022 | 1,924,698 | 1,081,465 | 843,233 | 34.2% |
| Year | Total users | Overnight | Day | Room occupancy |
|---|---|---|---|---|
| FY2023 | 2,627,890 | 1,518,272 | 1,109,618 | 46.7% |
| FY2024 | 2,444,672 | 1,426,380 | 1,018,292 | 46.8% |
| FY2025 | 2,415,665 | 1,336,827 | 1,078,838 | 45.9% |
The FY2025 evaluation reports 2,081,184 young users, 64.1% of 3,245,232, one tenth of the population aged 0-29. Among reasons for lower use it lists reviews of school events, heat-stroke measures (switching to facilities with air conditioning) and rising costs, covering 434 groups and 104,178 people (MEXT evaluation). Public youth education facilities fell from 746 in FY2002 to 337 in FY2021 (MEXT, reference materials, p. 67, citing the MEXT Social Education Survey).
Playing in and observing nature by prefecture (FY2025 National Assessment of Academic Ability)
In the FY2025 National Assessment of Academic Ability (April 2025), question 25 asked pupils "In your life so far, have you played in nature or observed nature?" (our translation). The two positive options were chosen by 80.6% of grade 6 and 75.7% of grade 9 pupils in public schools. Akita (85.8%), Aomori (84.2%) and Miyazaki (83.9%) were highest for grade 6, and Akita (82.1%), Kochi (81.4%) and Iwate (80.1%) for grade 9. Saga was 41st for grade 6 (79.1%) and 18th for grade 9 (76.9%) (MEXT and NIER, FY2025 questionnaire results, calculated and sorted by us).
| Grade 6 rank | Prefecture | Grade 6 (%) | Grade 9 (%) | Grade 9 rank |
|---|---|---|---|---|
| 1 | Akita | 85.8 | 82.1 | 1 |
| 2 | Aomori | 84.2 | 79.0 | 6 |
| 3 | Miyazaki | 83.9 | 78.9 | 7 |
| 4 | Iwate | 83.6 | 80.1 | 3 |
| 4 | Yamanashi | 83.6 | 78.4 | 12 |
| 6 | Oita | 83.3 | 79.2 | 5 |
| 7 | Nagano | 83.0 | 78.7 | 10 |
| 8 | Fukushima | 82.9 | 78.5 | 11 |
| 8 | Gunma | 82.9 | 78.3 | 13 |
| 8 | Nagasaki | 82.9 | 78.8 | 9 |
| 11 | Kochi | 82.6 | 81.4 | 2 |
| 12 | Fukui | 82.5 | 77.7 | 15 |
| 13 | Shizuoka | 82.4 | 76.5 | 21 |
| 14 | Toyama | 82.2 | 78.9 | 7 |
| 15 | Shiga | 82.1 | 74.9 | 39 |
| 16 | Tochigi | 82.0 | 77.4 | 16 |
| 17 | Saitama | 81.9 | 75.0 | 38 |
| 17 | Tokushima | 81.9 | 76.8 | 19 |
| 19 | Yamagata | 81.8 | 79.9 | 4 |
| 19 | Gifu | 81.8 | 77.9 | 14 |
| 21 | Ibaraki | 81.7 | 76.5 | 21 |
| 22 | Hiroshima | 81.5 | 76.4 | 25 |
| 22 | Kagoshima | 81.5 | 75.8 | 31 |
| 24 | Hokkaido | 81.3 | 75.7 | 33 |
| 24 | Yamaguchi | 81.3 | 75.6 | 36 |
| 26 | Kanagawa | 81.2 | 76.1 | 28 |
| 26 | Niigata | 81.2 | 75.6 | 36 |
| 26 | Kumamoto | 81.2 | 76.8 | 19 |
| 29 | Ehime | 80.6 | 75.7 | 33 |
| 30 | Miyagi | 80.5 | 75.9 | 30 |
| 31 | Ishikawa | 80.4 | 77.3 | 17 |
| 32 | Chiba | 80.1 | 74.8 | 40 |
| 33 | Tokyo | 79.9 | 75.8 | 31 |
| 34 | Fukuoka | 79.8 | 76.5 | 21 |
| 35 | Mie | 79.5 | 76.3 | 26 |
| 35 | Wakayama | 79.5 | 74.4 | 42 |
| 35 | Okayama | 79.5 | 76.3 | 26 |
| 35 | Kagawa | 79.5 | 76.1 | 28 |
| 39 | Hyogo | 79.3 | 73.8 | 43 |
| 40 | Kyoto | 79.2 | 74.8 | 40 |
| 41 | Saga | 79.1 | 76.9 | 18 |
| 42 | Nara | 79.0 | 71.8 | 46 |
| 43 | Aichi | 78.8 | 73.0 | 44 |
| 44 | Tottori | 78.5 | 75.7 | 33 |
| 45 | Okinawa | 78.3 | 70.9 | 47 |
| 46 | Shimane | 77.6 | 76.5 | 21 |
| 47 | Osaka | 77.4 | 72.3 | 45 |
| Japan (public) | 80.6 | 75.7 |
Saga Prefecture (FY2025)
Of 6,973 grade 6 pupils in Saga (including 5 non-responses), 34.0% chose option 1 and 45.1% option 2, 79.1% in total. Of 6,778 grade 9 pupils (including 18 non-responses), the figures were 32.1% and 44.8%, 76.9% in total. Among the eight prefectures of Kyushu and Okinawa, Saga was 7th for grade 6 after Miyazaki (83.9%), Oita, Nagasaki and others, and 4th for grade 9 after Oita (79.2%), Miyazaki and Nagasaki (MEXT and NIER, sorted by us). Saga was 1.5 points below Japan for grade 6 and 1.2 points above for grade 9 (our calculation).
| Prefecture | Grade 6 (%) | Grade 6 rank in Japan | Grade 9 (%) | Grade 9 rank in Japan |
|---|---|---|---|---|
| Fukuoka | 79.8 | 34 | 76.5 | 21 |
| Saga | 79.1 | 41 | 76.9 | 18 |
| Nagasaki | 82.9 | 8 | 78.8 | 9 |
| Kumamoto | 81.2 | 26 | 76.8 | 19 |
| Oita | 83.3 | 6 | 79.2 | 5 |
| Miyazaki | 83.9 | 3 | 78.9 | 7 |
| Kagoshima | 81.5 | 22 | 75.8 | 31 |
| Okinawa | 78.3 | 45 | 70.9 | 47 |
An example from Karatsu (our work)
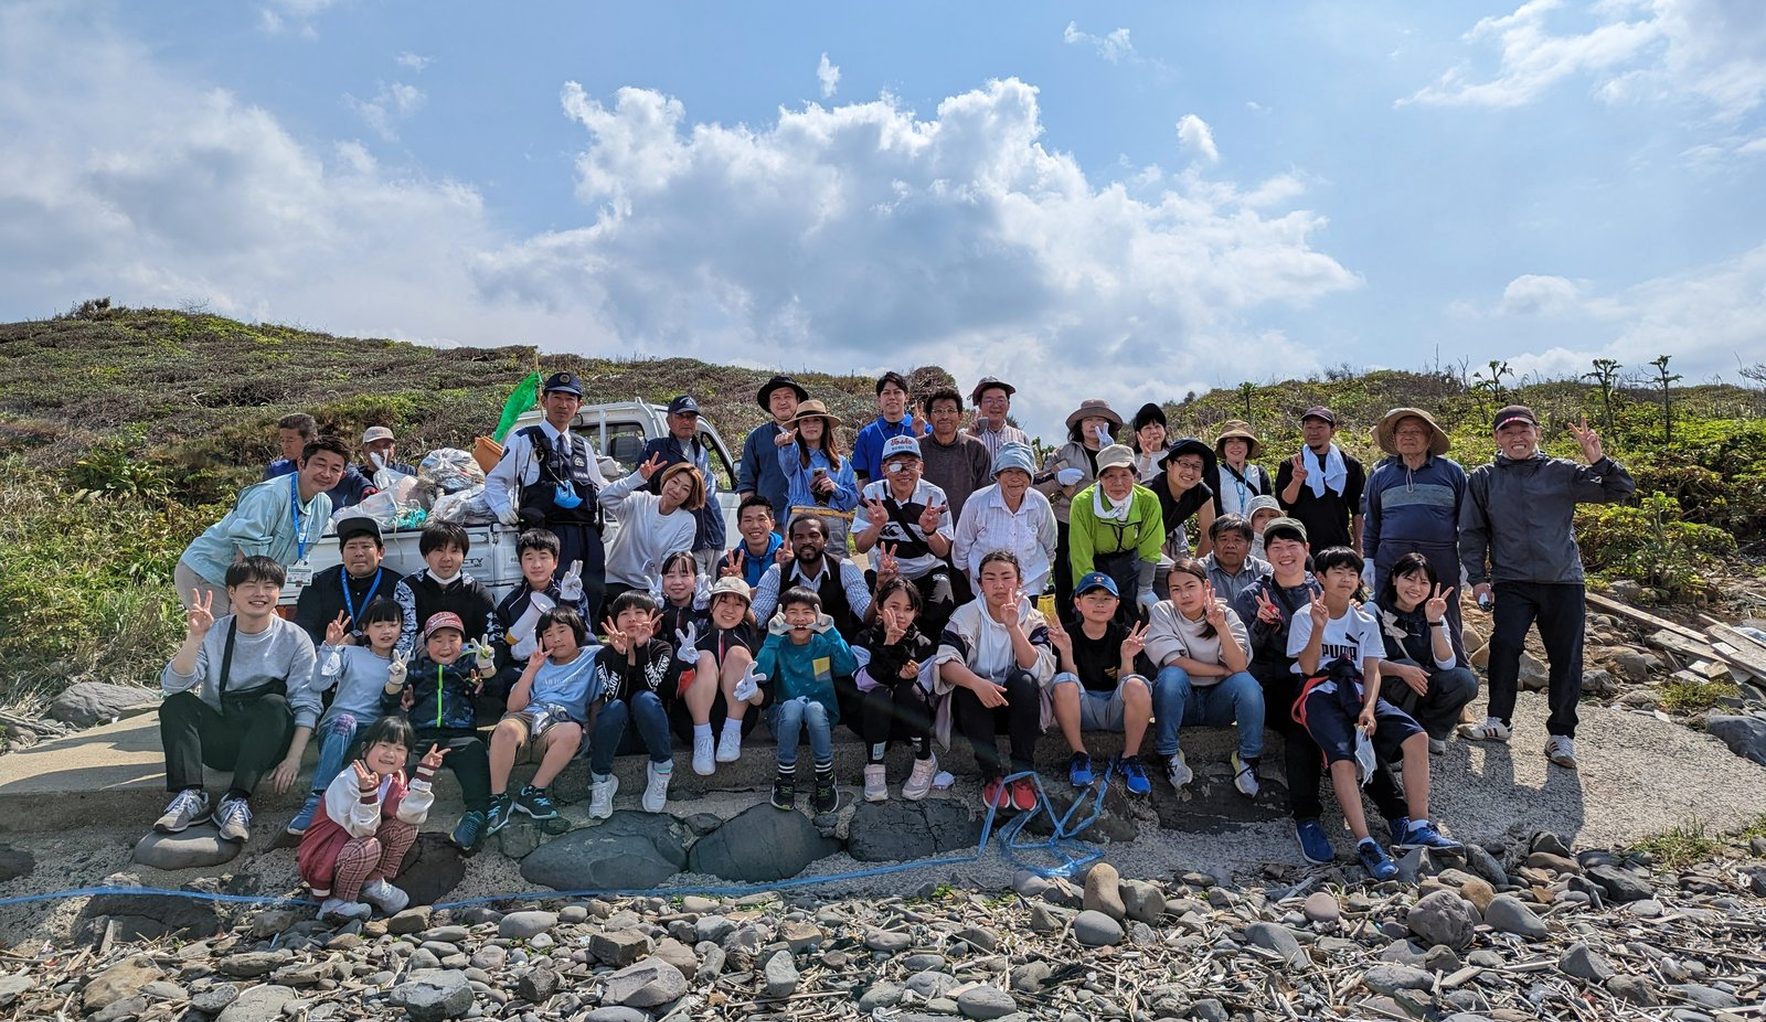
As part of Saga Prefecture's "Plasma LIFE Saga" initiative, since FY2023 we have worked with a school on one of Karatsu's outlying islands each year on environmental education in which children pick up and survey litter washed up on the shore (Ogawa Island in FY2023, Kakara Island in FY2024, Madara Island in FY2025 and Takashima in FY2026). On 23 October 2026 we held a coaster-making workshop with all 14 pupils of Takashima Elementary School. See Island ESD for each island.
For environmental education with island schools, visiting workshops or site visits, see "Citing this page and enquiries" below.
Frequently asked questions
Q1. Are children's nature experiences declining in Japan?
In the NIYE survey, children in grades 4-6, 8 and 11 with rich or fairly rich nature experience were 44.7% in FY2012, 38.7% in FY2019 and 33.8% in FY2022. The report says nature experience tended to decline slightly through the 2010s and declined further in 2022 after the pandemic.
Q2. Which nature activities are most common?
In FY2022 the activities most often done "many times" were swimming in the sea or a river (45.4%), watching wild birds or hearing their calls (44.8%) and looking slowly at a sky full of stars (38.3%). The least was climbing a high mountain without a ropeway or lift (13.7%) (NIYE).
Q3. Which prefectures rank highest for playing in nature?
In the FY2025 National Assessment of Academic Ability, the share answering positively to "have you played in nature or observed nature?" was highest in Akita (85.8%), Aomori (84.2%) and Miyazaki (83.9%) for grade 6, and Akita (82.1%), Kochi (81.4%) and Iwate (80.1%) for grade 9 (calculated and sorted by us).
Q4. How does Saga compare?
In FY2025, 79.1% of grade 6 pupils in Saga (Japan 80.6%) answered positively, 41st of 47; grade 9 was 76.9% (Japan 75.7%), 18th (calculated and sorted by us).
Q5. Is there an income gap in nature experience?
In FY2022, 23.7% of children in grades 4-6 in households earning under ¥2 million had rich or fairly rich nature experience, against 39.2% at ¥12 million or more. A MEXT-commissioned analysis of a national longitudinal survey found 11.1% of children whose parents earned under ¥1 million did all three of camping-type activities, sea bathing and winter sports, against 34.9% at ¥10 million or more.
Q6. Is nature experience linked to self-esteem?
In FY2022, 49.3% of children with rich nature experience were in the high self-esteem group, against 23.9% of those with poor nature experience; the report describes a tendency. This is an association between answers given at the same time, not evidence of cause.
Q7. How do Japanese schools treat nature experience activities?
The School Education Act lists promoting nature experience activities in and out of school as a goal of compulsory education (Art. 21(2)) and asks primary schools to enrich them (Art. 31). The 2017 primary curriculum guidelines ask for nature experience activities in moral education and school overnight events.
Q8. Can children experience nature and the sea in Karatsu?
As part of Saga Prefecture's "Plasma LIFE Saga" initiative, since FY2023 we have worked each year with a school on one of Karatsu's outlying islands on surveying litter washed up on the shore (Ogawa, Kakara, Madara and Takashima). See our Island ESD page.
Source register
| Document | Publisher | Date | URL | Accessed |
|---|---|---|---|---|
| Survey on youth experience activities, FY2022 report | National Institution for Youth Education (NIYE) | 2024-03 | https://koueki.net/user/niye/110376019-1zentai.pdf | 2026-11-20 |
| Survey on youth experience activities, FY2019 report | NIYE | 2021-03 | https://www.niye.go.jp/pdf/r3taikenzentai.pdf | 2026-11-20 |
| Survey on youth experience activities, FY2019 summary | NIYE | 2021-07-19 | https://www.niye.go.jp/pdf/r3taikengaiyou.pdf | 2026-11-20 |
| FY2020 study on promoting youth experience activities (analysis of the Longitudinal Survey of Babies in the 21st Century) | MEXT (commissioned to Hamagin Research Institute) | 2021-03 | https://www.mext.go.jp/content/20210908-mxt_chisui01-100003338_2.pdf | 2026-11-20 |
| Reference materials (document 1-3) | MEXT | 2024-07-04 | https://www.mext.go.jp/content/240704-mxt_syogai03-000036897_3.pdf | 2026-11-20 |
| Evaluation of NIYE's performance in FY2024 | Minister of Education, Culture, Sports, Science and Technology | posted 2025-08-28 | https://www.mext.go.jp/content/20250828-mxt_chisui02-100000113_1.pdf | 2026-11-20 |
| Evaluation of NIYE's performance in FY2025 | Minister of Education, Culture, Sports, Science and Technology | posted 2026-08-31 | https://www.mext.go.jp/content/20260831-mxt_chisui02-100000113_01.pdf | 2026-11-20 |
| Course of Study for primary schools (2017) | MEXT | 2017-03 | https://www.mext.go.jp/content/20230120-mxt_kyoiku02-100002604_01.pdf | 2026-11-20 |
| FY2025 National Assessment of Academic Ability, questionnaire results, primary (Saga, prefectural Excel) | MEXT and National Institute for Educational Policy Research (NIER) | 2025 | https://www.nier.go.jp/25chousakekkahoukoku/factsheet/41_saga/41p_25a.xlsx | 2026-11-20 |
| FY2025 National Assessment of Academic Ability, questionnaire results, junior high (Saga, prefectural Excel) | MEXT and NIER | 2025 | https://www.nier.go.jp/25chousakekkahoukoku/factsheet/41_saga/41m_25a.xlsx | 2026-11-20 |
| The Children’s People and Nature Survey for England: 2025 update | Natural England | 2025-12-10 (updated 2026-07-29) | https://www.gov.uk/government/statistics/the-childrens-people-and-nature-survey-for-england-2025-update/the-childrens-people-and-nature-survey-for-england-2025-update | 2026-11-20 |
Notes on reading the figures
Nature experience shares are from NIYE's reports. The series from 1998 (grades 4, 6 and 8) and from FY2012 (grades 4-6, 8 and 11) cover different children, so values differ for the same year and should not be joined. Up to 2009 the question did not include "so far". The FY2025 NIYE survey has been carried out but its report was not published as of 20 November 2026. We could not confirm the year or children's age for the eighth round of the longitudinal survey. Figures on self-esteem and moral sense are associations between answers given at the same time, not evidence of cause. Facility users up to FY2022 and from FY2023 come from different sources; we have not confirmed they are counted the same way. National Assessment figures are the sum of options 1 and 2 (our calculation); we did not check the option wording in the questionnaire. Prefectural ranks are our sorting, not published rankings. The question is not in the FY2026 primary questionnaire. England's survey asks differently and cannot be compared with Japan's figures. Quotations from Japanese documents are our translations.
What this page does not cover
UNESCO Schools and environmental education are on our ESD and environmental education data page, school trip destinations and costs on school trip destinations, nature and other activities at free schools on school non-attendance and free schools, and schools and pupils in Karatsu on Karatsu schools and pupil numbers. This page does not cover municipal figures, surveys by private organisations on the experience gap, or nature programmes and facilities.
Citing this page and enquiries
To cite figures from this page, or to ask about environmental education with island schools, visiting workshops or site visits, please use our contact page or write to info@karatsu-f-f.com.
About this page
By Hiroaki Kojima (Vice Director, Karatsu Farm & Food) / Contact: info@karatsu-f-f.com (contact page) / Published: 20 November 2026 / Markdown: nature-experience-data.mdThis page is made together with AI. See this data bank and AI for how.
Related links
▶ Karatsu Data Bank
▶ Island ESD
▶ ESD and environmental education data
▶ School trip destinations
▶ School non-attendance and free schools
▶ 子どもの自然体験のデータ2026(日本語)