
Plastic rankings, in numbers
In 2016 the United States generated more plastic waste than any other country, an estimated 42.03 Mt, while Japan ranked 10th of the top 20 with 4.88 Mt (Law et al., 2020). This page sets out country and regional rankings of plastic waste, plastic waste per person, recycling rates and production, using figures from international organisations, peer-reviewed research and official statistics. Rankings change with what is counted (plastic in all waste or packaging only), the year and the method, so each source has its own table.
Karatsu Farm & Food, a nonprofit in Karatsu, Saga, made this page as part of the Karatsu Data Bank. It gives no conclusions or evaluations, only figures and statements from the sources. Ranks are our ordering of the values in each source table. No values have been read off charts. Country rankings of plastic entering the ocean are on Plastics in Numbers.
| Rank | Country | Plastic waste | Per capita (kg/yr) | Per capita rank |
|---|---|---|---|---|
| 1 | United States | 42.03 Mt | 130.09 | 1 |
| 2 | India | 26.33 Mt | 19.88 | 18 |
| 3 | China | 21.60 Mt | 15.67 | 19 |
| 4 | Brazil | 10.68 Mt | 51.78 | 10 |
| 5 | Indonesia | 9.13 Mt | 34.90 | 16 |
| 6 | Russian Federation | 8.47 Mt | 58.66 | 8 |
| 7 | Germany | 6.68 Mt | 81.16 | 4 |
| 8 | United Kingdom | 6.47 Mt | 98.66 | 2 |
| 9 | Mexico | 5.90 Mt | 47.86 | 12 |
| 10 | Japan | 4.88 Mt | 38.44 | 15 |
| 11 | Thailand | 4.80 Mt | 69.54 | 5 |
| 12 | Korea, Rep. | 4.51 Mt | 88.09 | 3 |
| 13 | Italy | 3.37 Mt | 55.51 | 9 |
| 14 | Egypt | 3.04 Mt | 32.16 | 17 |
| 15 | France | 2.93 Mt | 43.81 | 13 |
| 16 | Pakistan | 2.73 Mt | 13.42 | 20 |
| 17 | Argentina | 2.66 Mt | 60.95 | 7 |
| 18 | Algeria | 2.09 Mt | 51.59 | 11 |
| 19 | Malaysia | 2.06 Mt | 67.09 | 6 |
| 20 | Spain | 1.83 Mt | 39.42 | 14 |
Plastic waste by country (2016)
Based on World Bank municipal waste data, the United States generated the most plastic waste in 2016, 42.03 Mt or 130.09 kg per person, followed by India (26.33 Mt) and China (21.60 Mt) (Law et al., 2020). The authors note that the EU-28 countries together generated more than either India or China.
Japan generated 4.88 Mt, 10th of the top 20, and 38.44 kg per person, 15th of the 20. The highest per person were the United States (130.09 kg), the United Kingdom (98.66 kg) and Korea (88.09 kg). The estimate covers municipal waste only. Japan's own statistics put total plastic waste, including industrial waste, at 9.11 Mt in 2024 (Plastic Waste Management Institute); the scope and year differ, so they are not compared in one table.
| Rank | Region | Plastic waste per person (kg/yr) | Plastic use per person (kg/yr) |
|---|---|---|---|
| 1 | USA | 221 | 255.2 |
| 2 | Canada | 178 | 202.2 |
| 3 | OECD EU countries | 122 | 152.9 |
| 4 | OECD non-EU countries | 94 | 124.3 |
| 5 | Other EU | 75 | 103.0 |
| 6 | OECD Asia (Japan and Korea) | 69 | 102.4 |
| 7 | OECD Oceania | 62 | 143.9 |
| 8 | Other OECD America | 58 | 65.4 |
| 9 | Other Eurasia | 53 | 66.7 |
| 10 | China | 47 | 69.0 |
| 11 | Latin America | 43 | 50.9 |
| 12 | Middle East & North Africa | 38 | 47.1 |
| 13 | Other non-OECD Asia | 21 | 31.7 |
| 14 | Other Africa | 15 | 15.9 |
| 15 | India | 14 | 22.1 |
| World | 46 | 60.1 | |
| OECD | 126 | 155.8 | |
| Non-OECD | 29 | 39.3 |
Plastic waste and use per person by region (2019)
According to the OECD's 2022 outlook, plastic waste per person in 2019 was 221 kg in the United States, 122 kg in OECD EU countries and 69 kg in Japan and Korea (OECD Asia). The world average was 46 kg and the non-OECD average 29 kg (OECD, 2022). Plastic use per person was 255.2 kg in the United States, 102.4 kg in Japan and Korea and 60.1 kg worldwide (OECD, 2022).
The OECD states that almost half of all plastic waste is generated in OECD countries (OECD, 22 February 2022). Of the 353 Mt of plastic waste generated worldwide in 2019, 9% (33 Mt) was recycled (OECD, 2022).
| Rank | Country | Recycling rate | Note |
|---|---|---|---|
| 1 | Latvia | 59.2% | |
| 2 | Belgium | 58.2% | |
| 3 | Slovakia | 54.1% | definition differs |
| 4 | Slovenia | 51.5% | |
| 5 | Germany | 51.3% | |
| 6 | Netherlands | 49.1% | |
| 7 | Italy | 49.0% | |
| 7 | Cyprus | 49.0% | estimated |
| 9 | Spain | 46.2% | |
| 10 | Luxembourg | 42.9% | |
| 10 | Lithuania | 42.9% | |
| 12 | Estonia | 42.4% | |
| 13 | Portugal | 39.5% | |
| 14 | Greece | 32.7% | |
| 15 | Romania | 32.0% | |
| 16 | Malta | 31.9% | |
| 17 | Ireland | 29.6% | |
| 18 | Finland | 29.3% | |
| 19 | Sweden | 28.6% | |
| 20 | Croatia | 28.2% | |
| 21 | Austria | 26.9% | |
| 22 | France | 25.7% | |
| 23 | Denmark | 22.7% | |
| EU27 average | 41.6% | imputed by Eurostat | |
| Norway (non-EU) | 30.2% |
Plastic packaging recycling rates in EU countries (2023)
Eurostat puts the EU27 plastic packaging recycling rate at 41.6% in 2023. The highest rates were in Latvia (59.2%), Belgium (58.2%) and Slovakia (54.1%), and the lowest in Denmark (22.7%), France (25.7%) and Austria (26.9%) (Eurostat). 2024 values are missing for some countries; the EU27 figure is 42.4% and the highest reported is Latvia at 71.0%.
These rates cover plastic packaging only. Japan's "effective utilisation rate" (below) covers more than packaging and also counts plastic burned to recover heat or power, so the two are not compared in one table.
| Item | Value | Year | Source |
|---|---|---|---|
| World plastics production | 430.9 Mt | 2024 | Plastics Europe |
| Europe (EU27 + Norway, Switzerland, UK) | 54.6 Mt (12% of world) | 2024 | Plastics Europe |
| Japan resin production | 8.53 Mt (down 0.35 Mt) | 2024 | Plastic Waste Management Institute |
Plastics production (world and Japan, 2024)
Plastics Europe, the European plastics manufacturers' association, puts world plastics production in 2024 at 430.9 Mt, of which Europe (EU27, Norway, Switzerland and the UK) produced 54.6 Mt, 12% of the total (Plastics Europe). Japan produced 8.53 Mt of resin in 2024 (Plastic Waste Management Institute).
| Item | Amount or share (2024) |
|---|---|
| Total plastic waste | 9.11 Mt (industrial 5.16 Mt, municipal 3.95 Mt) |
| Effective utilisation rate | 89% |
| of which material recycling | 20% |
| of which chemical recycling | 3% |
| of which thermal recycling (energy recovery) | 67% |
| Not used (incineration without recovery, landfill) | 11% (1.01 Mt): incineration 8%, 0.69 Mt; landfill 4%, 0.32 Mt |
| Exports of material recycling output | 1.10 Mt (about 60%): scrap 0.55 Mt, recycled material 0.55 Mt |
Japan: where discarded plastic goes
According to the Plastic Waste Management Institute, Japan generated 9.11 Mt of plastic waste in 2024 and its effective utilisation rate was 89%: material recycling 20%, chemical recycling 3% and thermal recycling (burning to recover heat or power) 67% (Plastic Waste Management Institute). About 60% (1.10 Mt) of material recycling output is exported.
From this release the institute changed how incineration with heat use is counted, in line with ISO standards, so values before the change are not directly comparable.
| Indicator | Japan | Saga Prefecture | Karatsu City |
|---|---|---|---|
| Recycling rate (all waste) | 19.3% | 18.2% | 16.9% |
| Waste per person per day | 839 g | 835 g | 891 g |
| Plastic containers and packaging recycled (excl. white trays) | - | 469 t | 0 t |
| PET bottles recycled | - | 1,611 t | 220 t |
Saga Prefecture and Karatsu City
The Ministry of the Environment's municipal waste survey puts the FY2024 recycling rate (all waste) at 19.3% for Japan, 18.2% for Saga Prefecture and 16.9% for Karatsu City. Karatsu recycled 0 t of plastic containers and packaging and 220 t of PET bottles; Saga Prefecture as a whole recycled 469 t and 1,611 t (Ministry of the Environment).
In Karatsu, plastics other than PET bottles are collected as burnable waste. The city's plans for separate collection and its pilot are on Plastics in Numbers.
Plastic collected in Karatsu (our work)
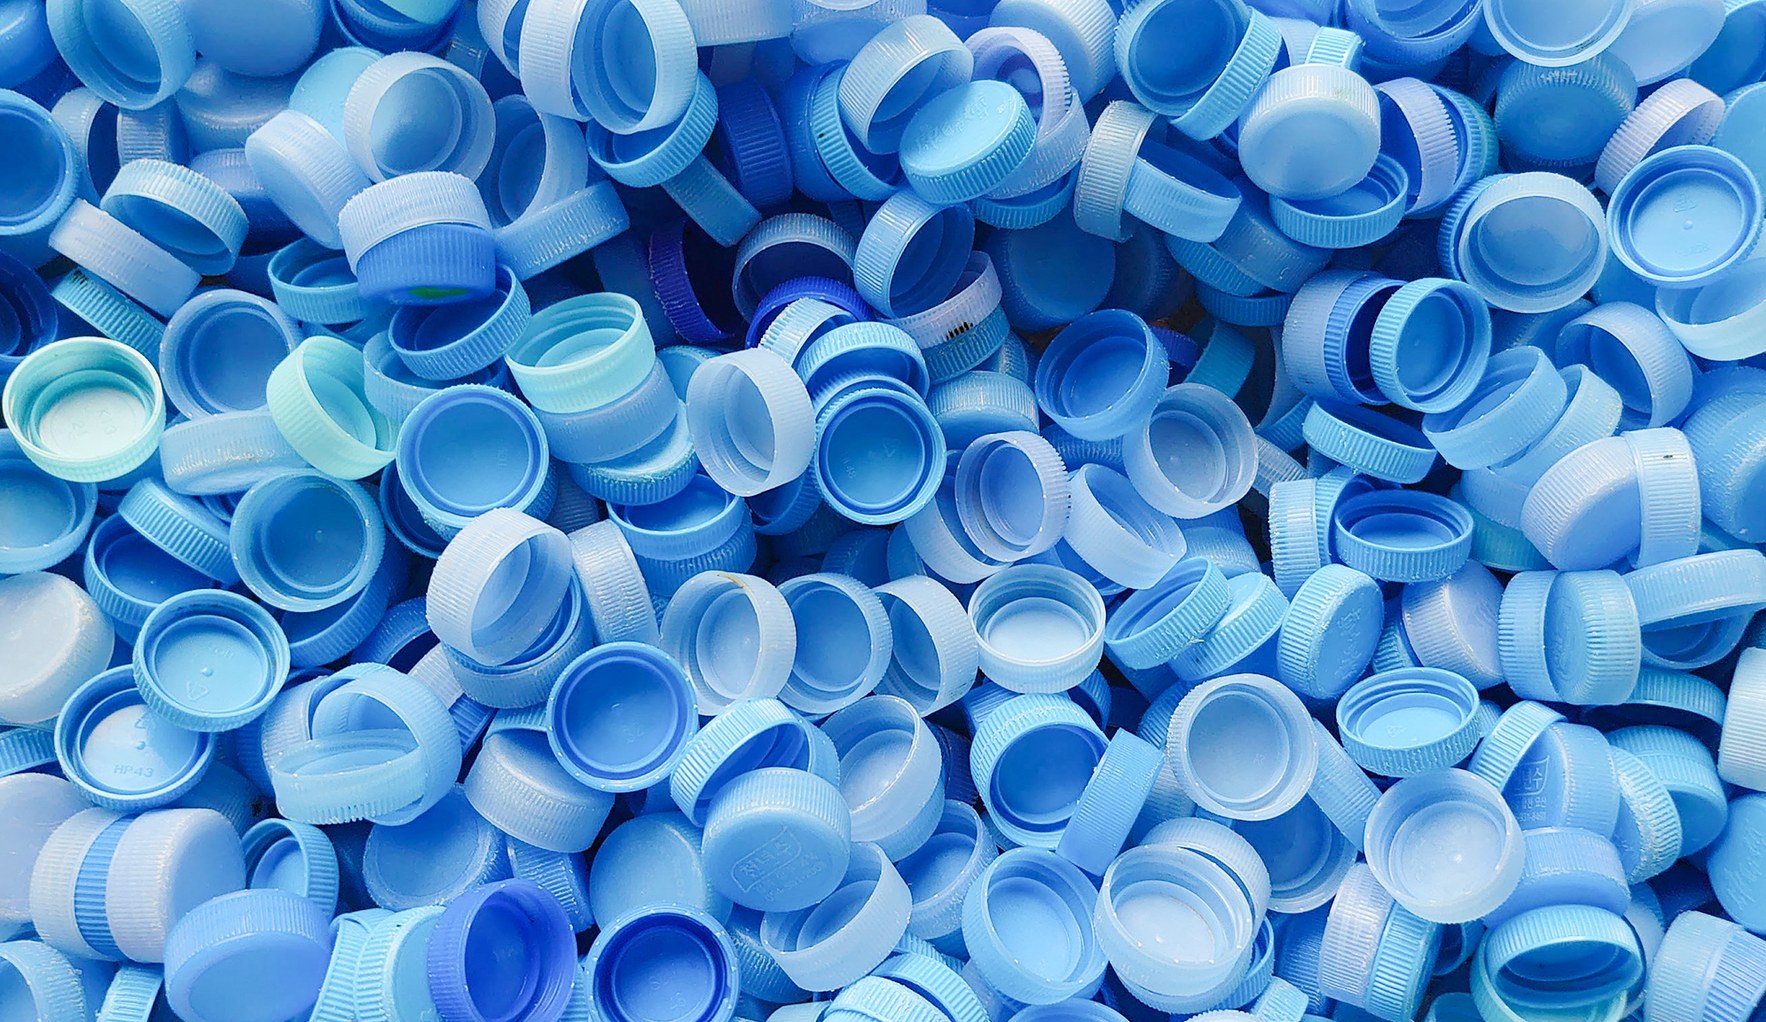
As Precious Plastic Karatsu, we collect PET bottle caps from homes, schools and beaches and turn them into products with small machines. We have collected 3,026 kg of caps in total (as of April 2026, our records).
Frequently asked questions
Q1. Which country generates the most plastic waste?
In the 2016 estimate by Law et al. (2020), the United States generated the most, 42.03 Mt, followed by India (26.33 Mt) and China (21.60 Mt). Japan was 10th of the top 20 with 4.88 Mt.
Q2. Does Japan generate a lot of plastic waste per person?
In the 2016 estimate by Law et al. (2020), Japan generated 38.44 kg per person, 15th of the top 20. In the OECD's 2019 figures, Japan and Korea averaged 69 kg, against 221 kg in the United States, 122 kg in OECD EU countries and a world average of 46 kg. The two sources count differently.
Q3. Which countries have the highest plastic recycling rates?
According to Eurostat, the highest plastic packaging recycling rates in 2023 were in Latvia (59.2%), Belgium (58.2%) and Slovakia (54.1%). The EU27 average was 41.6%.
Q4. What is Japan's plastic recycling rate?
According to the Plastic Waste Management Institute, Japan's effective utilisation rate in 2024 was 89%: material recycling 20%, chemical recycling 3% and thermal recycling (energy recovery) 67%.
Q5. What is the recycling rate in Karatsu?
The Ministry of the Environment puts Karatsu City's FY2024 recycling rate (all waste) at 16.9%, against 18.2% for Saga Prefecture and 19.3% for Japan. Karatsu recycled 0 t of plastic containers and packaging.
Sources
| Source | Publisher | Date | URL | Accessed |
|---|---|---|---|---|
| Law et al. The United States' contribution of plastic waste to land and ocean. Science Advances 6(44) | AAAS (peer-reviewed) | 2020-10-30 | https://doi.org/10.1126/sciadv.abd0288 | 2026-10-31 |
| Global Plastics Outlook: Economic Drivers, Environmental Impacts and Policy Options (Table 2.4) | OECD | 2022-02 | https://www.oecd.org/content/dam/oecd/en/publications/reports/2022/02/global-plastics-outlook_a653d1c9/de747aef-en.pdf | 2026-10-31 |
| Global Plastics Outlook: Policy Scenarios to 2060 (Chapter 4, Table 4.1) | OECD | 2022-06 | https://www.oecd.org/en/publications/global-plastics-outlook_aa1edf33-en/full-report/component-10.html | 2026-10-31 |
| Plastic pollution is growing relentlessly as waste management and recycling fall short, says OECD | OECD | 2022-02-22 | https://www.oecd.org/en/about/news/press-releases/2022/02/plastic-pollution-is-growing-relentlessly-as-waste-management-and-recycling-fall-short.html | 2026-10-31 |
| Recycling rates of packaging waste for monitoring compliance with policy targets, by type of packaging (env_waspacr) | Eurostat | updated 2026-10-21 | https://ec.europa.eu/eurostat/databrowser/view/env_waspacr/default/table?lang=en | 2026-10-31 |
| Plastics the Fast Facts 2025 | Plastics Europe | 2025-09 | https://plasticseurope.org/wp-content/uploads/2025/09/PE_TheFacts_25_digital-1pager-scrollable.pdf | 2026-10-31 |
| Plastic products production, disposal, recycling and treatment in 2024 (material flow) [Japanese] | Plastic Waste Management Institute | 2025-12-24 | https://www.pwmi.or.jp/column/column-2700/ | 2026-10-31 |
| Municipal waste survey FY2024, Saga Prefecture [Japanese] | Ministry of the Environment | 2026-03 | https://www.env.go.jp/recycle/waste_tech/ippan/r6/data/shori/city/41/01.xlsx | 2026-10-31 |
| Municipal waste generation and treatment, FY2024 [Japanese] | Ministry of the Environment | 2026-03-27 | https://www.env.go.jp/press/press_03502.html | 2026-10-31 |
Where sources differ
The OECD's February 2022 press release gives 114 kg of plastic waste per person for European OECD countries (OECD), while Table 4.1 of the report splits Europe into EU members (122 kg) and non-EU members (94 kg). This page uses the table values. Table 1 of Law et al. (2020) gives two US values (the refined 42.03 Mt and the World Bank-based 34.02 Mt); ranks use the refined value.
What this page does not cover
This page does not cover country rankings of plastic entering the ocean (see Plastics in Numbers), regional production shares shown only in charts in the Plastics Europe source, evaluations of national policies, or figures we could not confirm in primary sources. A country list of plastic waste for years after 2016 using the same method could not be confirmed in primary sources in our search on 31 October 2026, so none is given.
Citing this page and enquiries
To cite these figures, or to discuss plastic collection and recycling workshops, use our contact page or info@karatsu-f-f.com.
About this page
By Hiroaki Kojima (Vice Director, Karatsu Farm & Food) / Contact: info@karatsu-f-f.com (contact page) / Published 31 October 2026 / Markdown: plastic-ranking-data.mdThis page is made together with AI. See this data bank and AI for how.
Related links
▶ Karatsu Data Bank
▶ Plastics in Numbers
▶ Precious Plastic in Numbers
▶ Why recycling ocean plastic is hard
▶ Circular economy in numbers
▶ 日本語版