
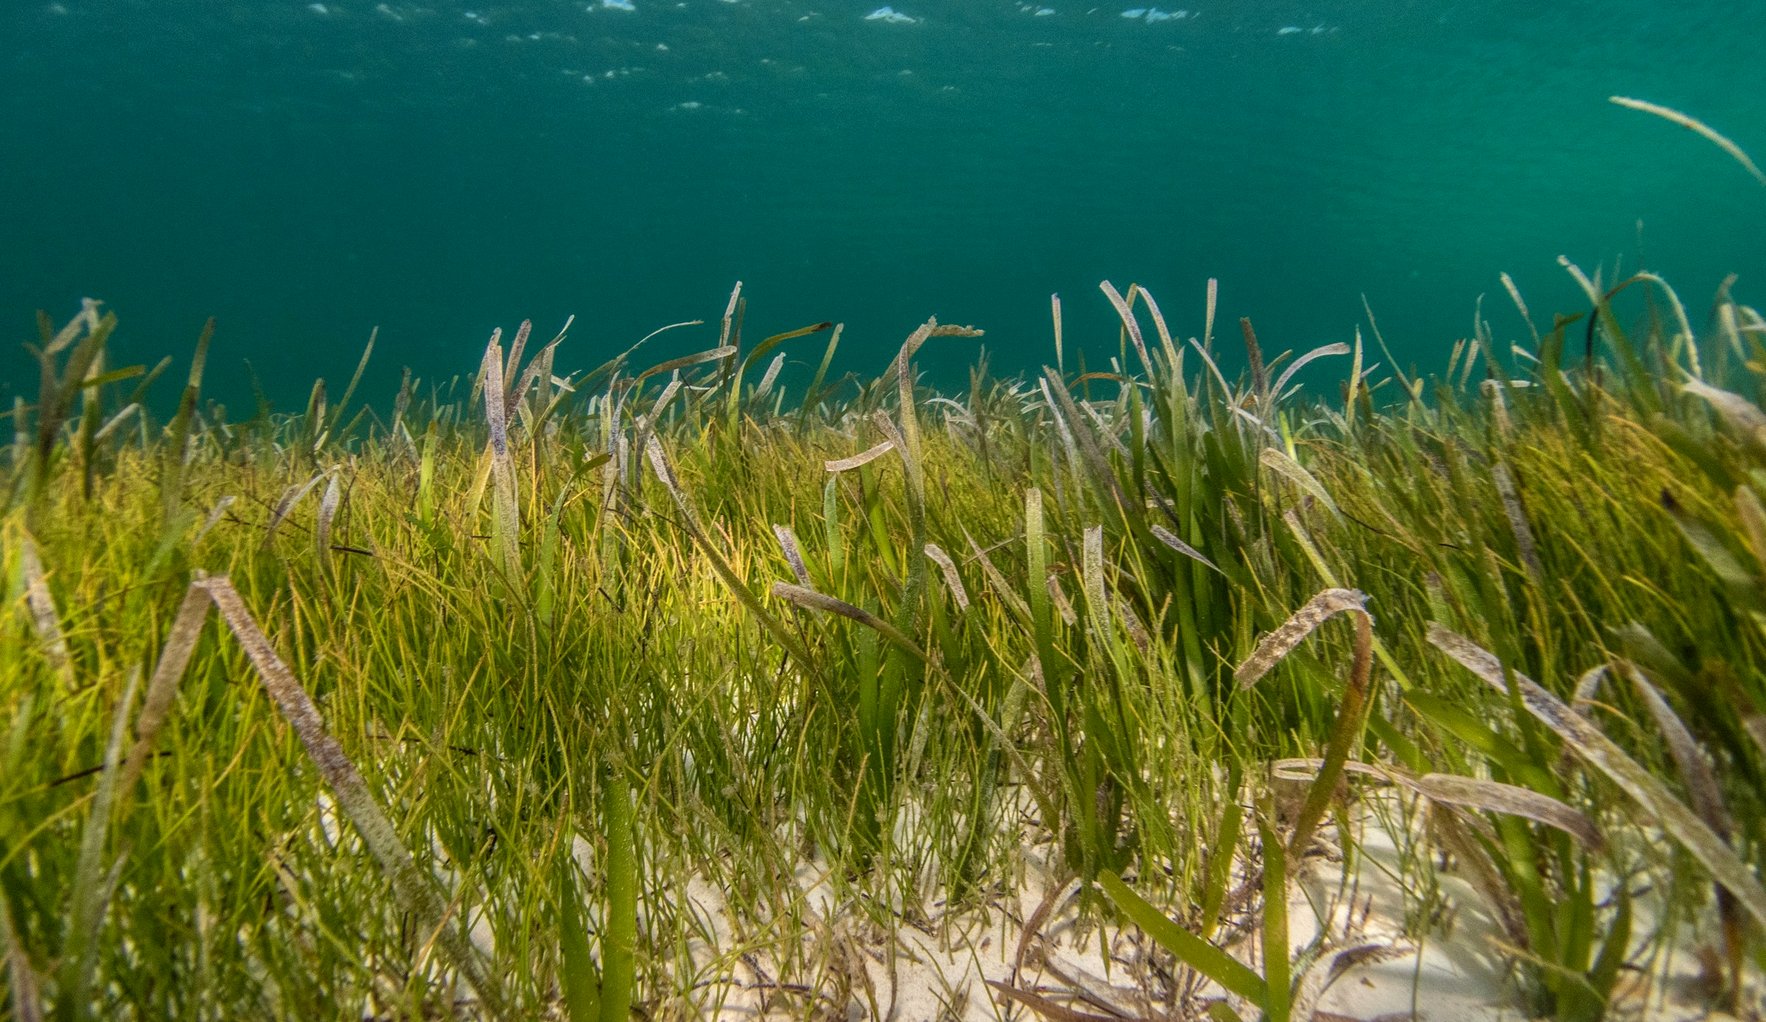
What are blue carbon and J Blue Credits? (2026)
J Blue Credits are credits certified by the Japan Blue Economy Association (JBE, authorised by the Minister of Land, Infrastructure, Transport and Tourism) for the extra CO2 removed by protecting and restoring seaweed and seagrass beds, tidal flats and similar ecosystems. In FY2025, 52 projects totalling 3,089.9 t-CO2 were certified, up from 1 project and 22.8 t-CO2 when the scheme began in FY2020 (MLIT, August 2026). In the national greenhouse gas inventory, removals by seaweed/seagrass beds and mangroves were reported at about 320,000 t-CO2 in FY2024 (Ministry of the Environment, April 2026).
Karatsu Farm & Food compiled this page as part of the Karatsu Data Bank. It lists figures on blue carbon (carbon taken up and stored by coastal and marine ecosystems such as seagrass and seaweed beds, tidal flats and mangroves): the number and volume of credits and national removals and targets, as published by MLIT, the Ministry of the Environment and international bodies. We add no conclusions or evaluations. Seaweed bed area and barren grounds are on seaweed beds data; credit revenue and costs are on nature credits data.
Global extent of blue carbon ecosystems and their place in climate action
| Item | Value | Source |
|---|---|---|
| Mangrove area (2020) | 147,256 km² | Global Mangrove Alliance, 2024 |
| Average carbon stored by mangroves per hectare | 394 t | Global Mangrove Alliance, 2024 |
| Documented seagrass area | 160,387 km² (103 countries/territories); 266,562 km² including low-confidence areas | UNEP, 2020 |
| Countries with seagrass | 159; estimated over 300,000 km² | UNEP, 2020 |
| Added uptake and storage from restoring coastal blue carbon ecosystems | about 0.5% of current global emissions a year (medium confidence) | IPCC SROCC, 2019 |
| NDCs from coastal and island countries submitted in 2025 that include ocean measures | 61 of 66 (92%); 62% in 2015, 73% in 2022 | WRI et al., Nov 2025 |
World mangrove area by region (2020)
| Rank | Region | Area (km²) | Share of world |
|---|---|---|---|
| 1 | Southeast Asia | 49,500 | 33.6% |
| 2 | West & Central Africa | 22,802 | 15.5% |
| 3 | North & Central America & Caribbean | 21,270 | 14.4% |
| 4 | South America | 19,469 | 13.2% |
| 5 | Australia & New Zealand | 10,348 | 7.0% |
| 6 | South Asia | 9,749 | 6.6% |
| 7 | East & Southern Africa | 7,749 | 5.3% |
| 8 | Pacific Islands | 5,790 | 3.9% |
| 9 | Middle East | 358 | 0.2% |
| 10 | East Asia | 221 | 0.2% |
| Total | 147,256 | 100% |
J Blue Credits certified, FY2020 to FY2025
| Fiscal year | Projects certified | Volume (t-CO2) | Source |
|---|---|---|---|
| FY2020 | 1 | 22.8 | JBE document 9 |
| FY2021 | 4 | 80.4 | JBE document 9 |
| FY2022 | 21 | 3,733.1 | JBE document 9 |
| FY2023 | 29 | 2,170.3 | JBE document 9 |
| FY2024 | 46 | 3,178.3 | MLIT |
| FY2025 | 52 | 3,089.9 | MLIT document 2 |
Of the 3,089.9 t-CO2 certified in FY2025, one project accounted for 1,303.2 t-CO2 (Iki, Nagasaki) and another for 639.9 t-CO2 (Lake Hamana, Shizuoka); the top two exceed 60%. The average per project was 59.4 t-CO2 (our calculation, MLIT). Yearly volumes rise and fall with a few large projects.
Prefecture ranking: J Blue Credit projects certified (FY2025)
| Rank | Prefecture | Projects | New | Continuing | Volume (t-CO2) |
|---|---|---|---|---|---|
| 1 | Hokkaido | 6 | 3 | 3 | 38.9 |
| 2 | Nagasaki | 5 | 2 | 3 | 1,335.7 |
| 2 | Kanagawa | 5 | 3 | 2 | 87.1 |
| 2 | Hyogo | 5 | 2 | 3 | 25.8 |
| 5 | Hiroshima | 3 | 1 | 2 | 99.8 |
| 5 | Yamaguchi | 3 | 0 | 3 | 88.7 |
| 5 | Okinawa | 3 | 3 | 0 | 2.4 |
| 5 | Kagoshima | 3 | 2 | 1 | 1.8 |
| 9 | Shizuoka | 2 | 1 | 1 | 641.0 |
| 9 | Osaka | 2 | 1 | 1 | 280.3 |
| 9 | Mie | 2 | 1 | 1 | 249.8 |
| 9 | Aomori | 2 | 1 | 1 | 81.1 |
| 9 | Ehime | 2 | 1 | 1 | 55.7 |
| 9 | Aichi | 2 | 0 | 2 | 53.3 |
| 9 | Fukuoka | 2 | 2 | 0 | 2.3 |
| 16 | Saga | 1 | 0 | 1 | 21.4 |
| 16 | Kumamoto | 1 | 0 | 1 | 10.2 |
| 16 | Miyagi | 1 | 1 | 0 | 5.2 |
| 16 | Kagawa | 1 | 1 | 0 | 2.4 |
| 16 | Tokushima | 1 | 1 | 0 | 1.6 |
| 16 | Chiba | 1 | 1 | 0 | 0.4 |
In FY2025, 21 prefectures had certified projects: Hokkaido (6), then Nagasaki, Kanagawa and Hyogo (5 each). In Kyushu, Nagasaki had 5 projects and 1,335.7 t-CO2 Fukuoka 2 projects and 2.3 t-CO2, Kagoshima 3 and Kumamoto 1. Saga had one, Kushiura in Chinzei, Karatsu, with 21.4 t-CO2 (our count, MLIT).
Japan's blue carbon removals and national targets (FY2023 to FY2040)
| Fiscal year | Removals (10,000 t-CO2) | Type |
|---|---|---|
| FY2023 | about 34 | Actual |
| FY2024 | about 32 | Actual |
| FY2030 | (no target set) | Plan |
| FY2035 | 100 | Target |
| FY2040 | 200 | Target |
Removals by forests and other sinks were about 52.3 million t-CO2 in FY2024, of which blue carbon was about 320,000 t-CO2 (MOE). Since the 2024 submission, Japan has counted both seagrass and seaweed beds (MOE).
How much do J Blue Credits sell for? (public sales)
| Sale | Volume (t-CO2) | Buyers (cumulative) | Average price (JPY/t-CO2, excl. tax) |
|---|---|---|---|
| FY2024 (extra, round 3) | 166.3 | 63 | 52,856 |
| FY2025 | 328.5 | 123 | 82,465 |
Credit prices compared with the cost of looking after seaweed beds are on nature credits data, alongside published estimates.
J Blue Credits in Saga and Karatsu (FY2022 to FY2025)
| Fiscal year | Project | Volume (t-CO2) |
|---|---|---|
| FY2022 | Kushiura seaweed bed (Chinzei) | 41.1 |
| FY2023 | Kushiura seaweed bed (Chinzei) | 35.3 |
| FY2024 | Kushiura seaweed bed (Chinzei) | 18.5 |
| FY2024 (certified Jan 2025) | Seaweed farming experience in Karatsu Bay (Sashi Elementary School et al.) | 0.4 |
| FY2025 | Kushiura seaweed bed (Chinzei) | 21.4 |
In Kushiura, Chinzei, local fishers have managed grazing animals on the seabed for over 20 years, and the restored beds earned 41.1 t-CO2 of J Blue Credits in FY2022. In Karatsu Bay, a seaweed farming experience run by the city, an elementary school, a university, companies and others was certified for 0.4 t-CO2 in January 2025 (Karatsu City). Seaweed bed area in Saga and the city's spending on bed conservation are on seaweed beds data.
An example in Karatsu (our work)
As part of Saga Prefecture's "Plasma LIFE Saga", we have run environmental education with children on Karatsu's outlying islands since FY2023, one island a year (Ogawa, Kakara, Madara, Takashima), picking up and studying beach litter. On Kakara Island in FY2024, 28 participants collected 79.9 kg of litter (island ESD). We are not involved in any J Blue Credit project. We welcome enquiries about ocean learning and school visits.
FAQ
Q1. What is blue carbon?
Carbon taken up through photosynthesis and stored on the seabed or in the deep sea by coastal and marine ecosystems such as seagrass and seaweed beds, tidal flats and mangroves. Japan's inventory reports removals by seaweed/seagrass beds and mangroves.
Q2. How many J Blue Credit projects have been certified?
52 projects and 3,089.9 t-CO2 in FY2025, up from 1 in FY2020, 4 in FY2021, 21 in FY2022, 29 in FY2023 and 46 in FY2024 (MLIT; Japan Blue Economy Association).
Q3. What are Japan's blue carbon removals and targets?
About 320,000 t-CO2 in FY2024 (Ministry of the Environment). The Plan for Global Warming Countermeasures (Feb 2025) targets 1 million t-CO2 in FY2035 and 2 million t-CO2 in FY2040.
Q4. How much do J Blue Credits cost?
In the FY2025 public sale, 328.5 t-CO2 went to 123 buyers (cumulative) at an average of JPY 82,465 per t-CO2 excluding tax (MLIT).
Q5. Which prefectures have the most J Blue Credits?
By number of projects in FY2025 (our count), Hokkaido leads with 6, followed by Nagasaki, Kanagawa and Hyogo with 5 each. By volume, Nagasaki leads with 1,335.7 t-CO2.
Q6. Are there J Blue Credits in Saga or Karatsu?
Yes. The Kushiura seaweed beds in Chinzei, Karatsu, were the first certified in Saga (41.1 t-CO2 in FY2022) and had 21.4 t-CO2 in FY2025. A seaweed farming experience in Karatsu Bay was certified for 0.4 t-CO2 (Karatsu City).
Sources
| Document | Publisher | Date | URL | Accessed |
|---|---|---|---|---|
| Efforts to expand blue carbon (MLIT study group on blue carbon, FY2026 1st meeting, document 2) | MLIT Ports and Harbours Bureau | 2026-08-25 | https://www.mlit.go.jp/kowan/content/002021105.pdf | 2026-11-17 |
| J Blue Credit certificate ceremony (press release) | MLIT Ports and Harbours Bureau | 2026-03-17 | https://www.mlit.go.jp/report/press/port06_hh_000330.html | 2026-11-17 |
| Multiple values of blue carbon in ports (incl. FY2024 certifications) | MLIT Ports and Harbours Bureau (hosted on MOE site) | 2026-01-22 | https://www.env.go.jp/content/000371371.pdf | 2026-11-17 |
| Status of the J Blue Credit scheme (document 9) | Japan Blue Economy Association | 2024-03 | https://www.mlit.go.jp/kowan/content/001726875.pdf | 2026-11-17 |
| J Blue Credit certification and issuance | Japan Blue Economy Association | 2026-10-16 | https://www.blueeconomy.jp/credit/ | 2026-11-17 |
| Japan's GHG emissions and removals in FY2024 (press release) | Ministry of the Environment | 2026-04-14 | https://www.env.go.jp/press/press_04043.html | 2026-11-17 |
| Blue carbon initiatives (FY2023 removals) | Ministry of the Environment | 2026 | https://www.env.go.jp/content/000371388.pdf | 2026-11-17 |
| MOE blue carbon initiatives (document 4, incl. Plan for Global Warming Countermeasures targets) | Ministry of the Environment | 2026-08-25 | https://www.mlit.go.jp/kowan/content/002021107.pdf | 2026-11-17 |
| Blue carbon initiatives | Karatsu City Environment Division | 2026-10-26 | https://www.city.karatsu.lg.jp/page/35470.html | 2026-11-17 |
| Special Report on the Ocean and Cryosphere in a Changing Climate, Summary for Policymakers (C.2.4) | IPCC | 2019 | https://www.ipcc.ch/site/assets/uploads/sites/3/2022/03/01_SROCC_SPM_FINAL.pdf | 2026-11-17 |
| The State of the World's Mangroves 2024 | Global Mangrove Alliance | 2024 | https://mangroveactionproject.org/wp-content/uploads/2024/07/SOWM-2024-HR.pdf | 2026-11-17 |
| Out of the blue: The value of seagrasses to the environment and to people | UNEP | 2020 | https://www.seagrasswatch.org/wp-content/uploads/Resources/Publications/2020/PDF/UNEP_2020-Out-of-the-blue.pdf | 2026-11-17 |
| More Countries Include Ocean Action in Climate Plans (press release) | World Resources Institute et al. | 2025-11-18 | https://www.wri.org/news/release-more-countries-include-ocean-action-climate-plans-biggest-climate-opportunities-still | 2026-11-17 |
Notes on reading the figures
J Blue Credit volumes are project-by-project values based on applications and differ in method and scope from national removals (about 320,000 t-CO2). Crediting periods are not always one year; some cover several years at once. Yearly counts are projects certified in that year, not the number of ongoing activities. The prefecture ranking is our count, using the locations in MLIT's list. Global areas come from sources with different methods (such as satellite resolution).
What this page does not cover
This page does not evaluate individual projects or buyers, overseas credit prices, seaweed bed area and barren grounds (seaweed beds data), credit economics (nature credits data) or Japan's total emissions (decarbonisation and CO2 data). Global tidal marsh area is not included because we could not check the original source.
Citing this page and enquiries
To cite figures from this page or to ask about ocean learning, school visits or corporate training, please use our contact page or write to info@karatsu-f-f.com.
About this page
By Hiroaki Kojima (Vice Director, Karatsu Farm & Food) / Contact: info@karatsu-f-f.com (contact page) / Published: 17 November 2026 / Markdown: blue-carbon-data.mdThis page is made together with AI. See this data bank and AI for how.
Related links
▶ Karatsu Data Bank
▶ Seaweed beds data
▶ Nature credits data
▶ Decarbonisation and CO2 data
▶ ブルーカーボンとJブルークレジットのデータ(日本語)