
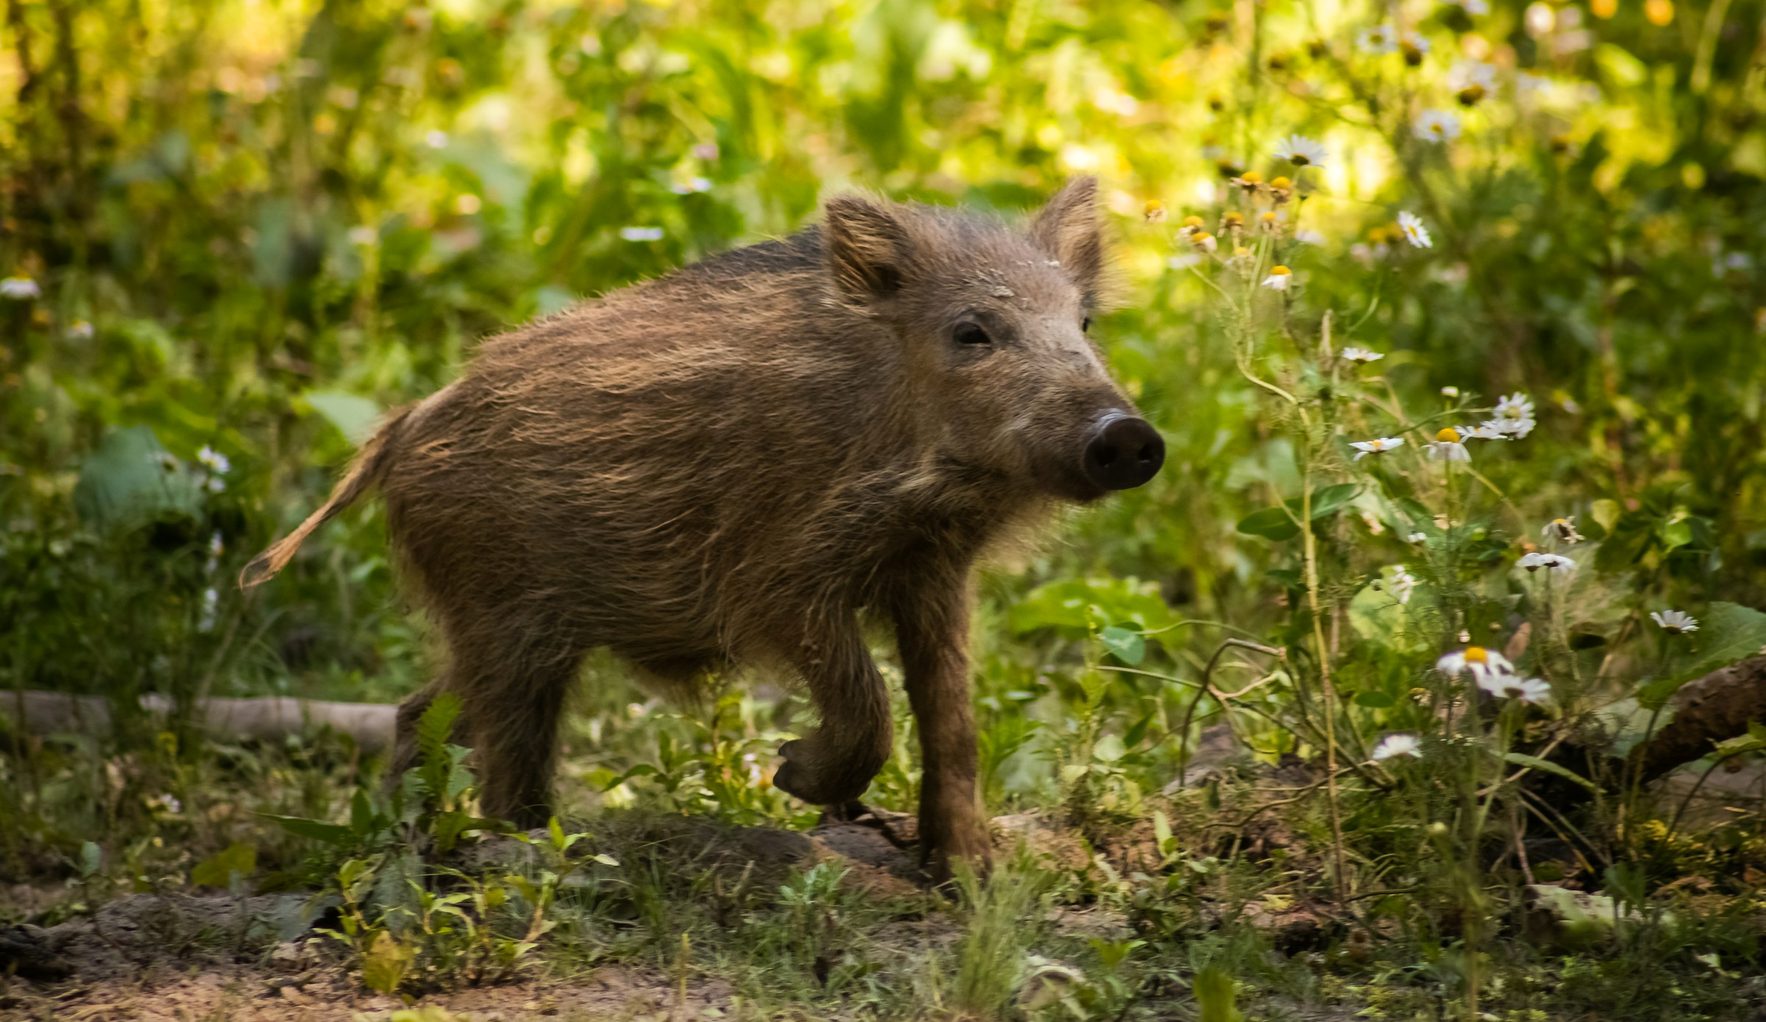
How much crop damage do wild animals cause in Japan? (FY2025)
Crop damage by wild birds and mammals in Japan was ¥18,288 million (about ¥18.3 billion) in FY2025 (April 2025 to March 2026), on about 29,000 ha with about 559,000 tonnes of crops lost (Ministry of Agriculture, Forestry and Fisheries (MAFF), crop damage by wild birds and mammals, FY2025). Hokkaido has the most damage at ¥6,865 million, followed by Nagano and Fukuoka. Saga ranks 26th of the 47 prefectures (our ranking of MAFF figures).
This page is part of the Karatsu Data Bank by Karatsu Farm & Food, a nonprofit in Karatsu, Saga Prefecture. It sets out figures on crop damage by wildlife from the world (an example from the United States) to Japan (prefectural ranking, species, trend, capture and control), Saga Prefecture (by municipality) and our own work in Karatsu, as published by the issuing bodies and without conclusions. MAFF compiles the damage figures from prefectural reports, which are in turn based on municipal reports. The Japanese fiscal year runs from April to March.
| Question | Figure | Period | Source |
|---|---|---|---|
| Damage, Japan | ¥18,288 million | FY2025 | MAFF |
| Area and volume of damage | about 29,000 ha, about 559,000 t | FY2025 | MAFF |
| Change from the previous year | ¥21 million less (FY2024: ¥18,309 million) | FY2024 as corrected | MAFF |
| Share caused by mammals | 85.8% (¥15.7 billion) | FY2025 | MAFF (share: our calculation) |
| Top prefecture | Hokkaido, ¥6,865 million | FY2025 | MAFF (our ranking) |
| Saga Prefecture | 26th of 47 | FY2025 | MAFF (our ranking) |
| Karatsu City | ¥56.7 million (highest in Saga) | FY2025 | MAFF |
| Feral swine damage, United States | over $3.4 billion a year | July 2026 funding notice | USDA NRCS |
Wildlife damage in the world (feral swine in the United States)
| Item | Figure | Note | Source |
|---|---|---|---|
| Total damage | over $3.4 billion a year | estimate, including agriculture | USDA Natural Resources Conservation Service (NRCS) |
| Damage and control costs | $2.5 billion a year | estimate | USDA Animal and Plant Health Inspection Service (APHIS) |
| Of which direct damage to agriculture | at least $800 million | estimate | USDA APHIS |
| States where found | at least 35 | USDA APHIS |
We did not find an international statistic that compares crop damage by wildlife country by country when preparing this page, so we show the United States as an example where a government agency publishes a figure. In its July 2026 funding notice, the US Department of Agriculture says feral swine cause over $3.4 billion in damage each year, including agricultural damage (NRCS). The research arm of its Animal and Plant Health Inspection Service estimates damage and control costs at $2.5 billion a year, with at least $800 million due directly to agriculture (APHIS). The two estimates cover different things, and neither is counted the same way as the Japanese figures, so they cannot be compared directly.
Crop damage by wildlife, ranking by prefecture (FY2025)
| Rank | Prefecture | Damage (¥ million) | Deer | Wild boar | Birds | Change from FY2024 |
|---|---|---|---|---|---|---|
| 1 | Hokkaido | 6,865.3 | 5,498.1 | 0.0 | 301.7 | +362.5 |
| 2 | Nagano | 637.8 | 230.4 | 46.9 | 216.8 | +62.2 |
| 3 | Fukuoka | 604.5 | 64.8 | 263.3 | 197.9 | −82.8 |
| 4 | Yamagata | 582.4 | 0.3 | 199.0 | 174.3 | +227.8 |
| 5 | Iwate | 571.0 | 252.3 | 71.1 | 90.3 | +158.1 |
| 6 | Kumamoto | 562.6 | 107.0 | 309.1 | 86.9 | −119.9 |
| 7 | Aichi | 548.1 | 45.2 | 138.3 | 228.9 | −28.5 |
| 8 | Niigata | 450.2 | 9.5 | 205.0 | 151.5 | +115.2 |
| 9 | Hyogo | 395.4 | 110.6 | 142.8 | 46.5 | −58.5 |
| 10 | Ibaraki | 350.3 | 0.0 | 113.3 | 188.2 | −27.5 |
| 11 | Ehime | 349.9 | 29.6 | 189.4 | 69.1 | −158.6 |
| 12 | Chiba | 331.0 | 10.1 | 149.8 | 65.4 | −16.1 |
| 13 | Mie | 318.2 | 112.7 | 109.6 | 24.1 | +75.3 |
| 14 | Shizuoka | 300.1 | 89.3 | 103.0 | 38.6 | +30.9 |
| 15 | Gunma | 299.0 | 120.9 | 42.6 | 24.7 | −44.1 |
| 16 | Miyazaki | 298.7 | 97.8 | 146.5 | 15.5 | −35.7 |
| 17 | Hiroshima | 290.0 | 77.1 | 158.0 | 36.2 | −67.9 |
| 18 | Kagoshima | 284.5 | 28.1 | 178.0 | 33.8 | −255.7 |
| 19 | Yamaguchi | 282.2 | 51.0 | 137.5 | 31.6 | −5.2 |
| 20 | Gifu | 275.4 | 71.2 | 114.2 | 30.7 | +1.1 |
| 21 | Kyoto | 267.7 | 99.2 | 106.7 | 32.9 | −77.9 |
| 22 | Tochigi | 255.8 | 32.6 | 131.6 | 33.1 | +13.0 |
| 23 | Osaka | 227.8 | 34.6 | 58.1 | 48.2 | −34.4 |
| 24 | Wakayama | 222.6 | 50.3 | 76.3 | 26.4 | −24.6 |
| 25 | Fukushima | 204.9 | 5.7 | 82.6 | 54.0 | +54.2 |
| 26 | Saga | 191.1 | 0.0 | 116.1 | 36.4 | −35.6 |
| 27 | Miyagi | 188.1 | 17.8 | 107.6 | 24.1 | +52.2 |
| 28 | Fukui | 178.2 | 92.4 | 75.8 | 1.5 | −12.7 |
| 29 | Kanagawa | 166.3 | 29.1 | 29.3 | 48.1 | +34.1 |
| 30 | Nagasaki | 159.6 | 3.0 | 128.0 | 23.4 | −51.4 |
| 31 | Kochi | 158.6 | 24.4 | 68.8 | 9.4 | −9.5 |
| 32 | Aomori | 153.4 | 9.5 | 38.3 | 29.4 | +88.9 |
| 33 | Oita | 150.2 | 32.2 | 104.3 | 3.6 | +13.9 |
| 34 | Yamanashi | 127.0 | 31.4 | 32.5 | 21.6 | −2.4 |
| 35 | Nara | 119.7 | 40.2 | 54.7 | 3.9 | −3.5 |
| 36 | Shiga | 107.9 | 26.4 | 51.9 | 7.2 | +22.2 |
| 37 | Akita | 103.4 | 0.4 | 7.9 | 19.0 | +83.9 |
| 38 | Okayama | 94.0 | 15.5 | 36.5 | 3.9 | −82.1 |
| 39 | Kagawa | 93.2 | 1.3 | 44.9 | 20.0 | −85.1 |
| 40 | Saitama | 91.7 | 16.3 | 15.7 | 17.5 | +8.8 |
| 41 | Shimane | 87.1 | 1.0 | 78.0 | 2.3 | +9.5 |
| 42 | Tokyo | 84.8 | 8.9 | 8.0 | 21.7 | −24.3 |
| 43 | Tokushima | 80.8 | 41.5 | 21.5 | 2.3 | −5.7 |
| 44 | Ishikawa | 63.4 | 0.0 | 43.0 | 17.0 | −0.4 |
| 45 | Okinawa | 44.2 | 0.0 | 23.1 | 15.7 | −31.9 |
| 46 | Tottori | 42.9 | 5.9 | 25.7 | 8.1 | −35.6 |
| 47 | Toyama | 27.7 | 0.1 | 17.9 | 5.6 | −17.6 |
Hokkaido accounts for 37.5% of national damage, and 80.1% of Hokkaido's damage is caused by deer (our calculation). Without Hokkaido, Nagano ranks first with ¥637.8 million, followed by Fukuoka (¥604.5 million) and Yamagata (¥582.4 million). Toyama has the least, at ¥27.7 million. Damage rose most in Hokkaido (up ¥362.5 million) and fell most in Kagoshima (down ¥255.7 million) (MAFF Reference 2).
Crop damage by species (FY2023 to FY2025)
| Species | FY2023 | FY2024 | FY2025 | Share in FY2025 |
|---|---|---|---|---|
| Deer | 6,954 | 7,407 | 7,625 | 41.7% |
| Wild boar | 3,634 | 4,461 | 4,402 | 24.1% |
| Crows | 1,341 | 1,365 | 1,287 | 7.0% |
| Bears | 738 | 519 | 935 | 5.1% |
| Monkeys | 705 | 770 | 740 | 4.0% |
| Raccoons | 482 | 687 | 669 | 3.7% |
| Masked palm civets | 365 | 478 | 420 | 2.3% |
| Bulbuls | 333 | 806 | 359 | 2.0% |
| All birds | 2,694 | 3,127 | 2,589 | 14.2% |
| All mammals | 13,661 | 15,183 | 15,699 | 85.8% |
| Total | 16,355 | 18,309 | 18,288 | 100% |
In FY2025, deer caused the most damage at ¥7,625 million, followed by wild boar at ¥4,402 million. Damage by bears was ¥935 million, up ¥416 million from the previous year. Among birds, crows caused the most at ¥1,287 million, and damage by bulbuls fell by ¥447 million (MAFF Attachment 1).
Trend in crop damage by wildlife (FY1999 to FY2025)
| Fiscal year | Damage (¥ million) | Deer | Wild boar |
|---|---|---|---|
| FY1999 | 21,004 | 4,878 | 4,364 |
| FY2003 | 19,935 | 3,950 | 5,010 |
| FY2008 | 19,886 | 5,816 | 5,376 |
| FY2010 | 23,949 | 7,750 | 6,799 |
| FY2013 | 19,909 | 7,555 | 5,491 |
| FY2018 | 15,786 | 5,411 | 4,738 |
| FY2019 | 15,804 | 5,305 | 4,622 |
| FY2020 | 16,121 | 5,642 | 4,565 |
| FY2021 | 15,544 | 6,104 | 3,932 |
| FY2022 | 15,562 | 6,501 | 3,650 |
| FY2023 | 16,355 | 6,954 | 3,634 |
| FY2024 | 18,309 | 7,407 | 4,461 |
| FY2025 | 18,288 | 7,625 | 4,402 |
Damage peaked at ¥23,949 million in FY2010; FY2025 is 76.4% of that peak (our calculation). Damage has risen from ¥15,562 million in FY2022 to about ¥18.3 billion in FY2024 and FY2025 (MAFF Reference 4). MAFF notes that wildlife damage discourages farming and leads to abandoned farmland and people leaving agriculture, with effects on rural areas more serious than the damage figures show (FY2025 Annual Report on Food, Agriculture and Rural Areas).
Capture and control systems (Japan)
| Item | Figure | Period |
|---|---|---|
| Wild boar captured | 643,000 | FY2024 |
| Deer captured | 739,000 | FY2024 |
| Municipalities with a damage prevention plan | 1,525 | end of April 2025 |
| Municipalities with a wildlife damage control unit | 1,266 | end of April 2025 |
| Members of the control units | 43,000 | end of April 2025 |
| Target for deer and wild boar populations | half of FY2011 | by FY2028 |
The national government funds capture systems, fences against intrusion and buffer zones under damage prevention plans drawn up by municipalities. Together with the Ministry of the Environment, it aims to halve deer and wild boar populations from FY2011 levels by FY2028 (MAFF annual report).
Saga Prefecture and Karatsu City (by municipality, FY2025)
| Municipality | Damage (¥ million) | Wild boar | Monkeys | Birds |
|---|---|---|---|---|
| Karatsu | 56.7 | 30.4 | 16.9 | 4.1 |
| Saga City | 24.0 | 15.0 | 0.0 | 8.9 |
| Imari | 16.0 | 11.4 | 0.0 | 2.0 |
| Kashima | 14.8 | 11.1 | 0.0 | 1.1 |
| Ogi | 14.4 | 3.3 | 0.0 | 4.7 |
| Tosu | 10.2 | 6.0 | 0.0 | 4.2 |
| Ureshino | 9.3 | 9.3 | 0.0 | 0.0 |
| Shiroishi | 8.4 | 1.1 | 0.0 | 7.3 |
| Tara | 8.3 | 7.4 | 0.0 | 0.2 |
| Arita | 7.9 | 3.8 | 0.0 | 2.7 |
| Taku | 7.5 | 7.1 | 0.0 | 0.0 |
| Genkai | 4.2 | 4.2 | 0.0 | 0.0 |
| Takeo | 2.8 | 2.8 | 0.0 | 0.1 |
| Kohoku | 1.5 | 0.2 | 0.0 | 0.2 |
| Kanzaki | 1.5 | 1.5 | 0.0 | 0.0 |
| Miyaki | 1.3 | 1.3 | 0.0 | 0.0 |
| Kamimine | 1.2 | 0.2 | 0.0 | 0.5 |
| Omachi | 0.5 | 0.0 | 0.0 | 0.5 |
| Kiyama | 0.4 | 0.2 | 0.0 | 0.1 |
| Yoshinogari | 0.1 | 0.1 | 0.0 | 0.0 |
| Total (source figure) | 191.1 | 116.1 | 16.9 | 36.4 |
Karatsu City has the most damage in Saga at ¥56.7 million, about 29.7% of the prefectural total (our calculation): ¥30.4 million by wild boar, ¥16.9 million by monkeys and ¥4.1 million by birds. Damage by monkeys in Karatsu equals the prefectural total for monkeys (¥16.9 million). Of the 1,532 municipalities in MAFF's municipal table, Karatsu ranks 64th (our ranking of MAFF Reference 3). Saga's damage by species, capture numbers and the trend over the last 20 years are on our green infrastructure data page.
An example from Karatsu (our work)
| Item | Figure | Period |
|---|---|---|
| Area of the Yokomakura nature symbiosis site (OECM) | 36.67 ha | certified by the Ministry of the Environment |
| Small hydro generator and electric fence in the irrigation channel | installed | 7 October 2026 |
| Clearing abandoned farmland (fewer places for wild boar to hide) | done | 1 November 2026 |
| Animals recorded by sensor cameras | on our biodiversity data page | August to September 2026 |
| Measured change in wildlife damage | being recorded; to be published once compiled |
We care for the satoyama landscape with local residents at Yokomakura in Ochi, Karatsu, the first site in Saga Prefecture certified as a nature symbiosis site by the Ministry of the Environment. On 7 October 2026 we installed a small hydro generator in the irrigation channel and use its power for an electric fence against wildlife. On 1 November we cleared abandoned farmland where wild boar had been hiding. Both are supported by the Japan Fund for Global Environment of the Environmental Restoration and Conservation Agency (ERCA). See Green Infrastructure at Yokomakura and Nature Positive and our OECM site.
For visits, training or partnerships on the electric fence and small hydro generator at Yokomakura, please see Citing this page and enquiries below.
Frequently asked questions
Q1. How much crop damage do wild animals cause in Japan?
Crop damage by wild birds and mammals was ¥18,288 million (about ¥18.3 billion) in FY2025 (April 2025 to March 2026), on about 29,000 ha with about 559,000 tonnes lost (MAFF). This is almost the same as ¥18,309 million in FY2024 (as corrected).
Q2. Which prefectures have the most wildlife crop damage?
In FY2025: 1 Hokkaido ¥6,865 million, 2 Nagano ¥637.8 million, 3 Fukuoka ¥604.5 million, 4 Yamagata ¥582.4 million, 5 Iwate ¥571.0 million (our ranking of MAFF figures).
Q3. Which animals cause the most damage?
In FY2025, deer caused the most at ¥7,625 million (41.7% of the total), followed by wild boar ¥4,402 million, crows ¥1,287 million, bears ¥935 million and monkeys ¥740 million (MAFF; shares our calculation).
Q4. Where does Saga Prefecture rank?
Saga ranks 26th of the 47 prefectures in FY2025 (our ranking). Within Saga, Karatsu City has the most damage at ¥56.7 million, about 29.7% of the prefectural total.
Q5. How much damage is there in Karatsu City?
¥56.7 million in FY2025: ¥30.4 million by wild boar, ¥16.9 million by monkeys and ¥4.1 million by birds (MAFF Reference 3). Karatsu ranks 64th of the 1,532 municipalities in MAFF's municipal table (our ranking).
Q6. Is wildlife crop damage increasing?
National damage peaked at ¥23,949 million in FY2010; FY2025 is 76.4% of that (our calculation). It has risen from ¥15,562 million in FY2022 to about ¥18.3 billion in FY2024 and FY2025 (MAFF).
Q7. Is there wildlife crop damage in other countries?
In the United States, the Department of Agriculture says feral swine cause over $3.4 billion in damage a year, including agriculture. Its Animal and Plant Health Inspection Service estimates damage and control costs at $2.5 billion a year, with at least $800 million directly to agriculture.
Q8. Can I see wildlife damage measures in Karatsu?
At Yokomakura in Ochi, Karatsu (a nature symbiosis site), we installed an electric fence powered by a small hydro generator on 7 October 2026 and cleared abandoned farmland on 1 November. Please contact us about visits and training.
Source register
| Document | Publisher | Date | URL | Accessed |
|---|---|---|---|---|
| Crop damage by wild birds and mammals in Japan (FY2025) | MAFF | 2026-10 (published) | https://www.maff.go.jp/j/seisan/tyozyu/higai/hogai_zyoukyou/index.html | 2026-11-20 |
| Attachment 1: crop damage by wild birds and mammals (FY2025) | MAFF | 2026-10 (published) | https://www.maff.go.jp/j/seisan/tyozyu/higai/hogai_zyoukyou/attach/pdf/index-60.pdf | 2026-11-20 |
| Attachment 2: crop damage by species over time | MAFF | 2026-10 (published) | https://www.maff.go.jp/j/seisan/tyozyu/higai/hogai_zyoukyou/attach/pdf/index-65.pdf | 2026-11-20 |
| Reference 2: crop damage by prefecture (FY2025) | MAFF | 2026-10 (published) | https://www.maff.go.jp/j/seisan/tyozyu/higai/hogai_zyoukyou/attach/xls/index-34.xlsx | 2026-11-20 |
| Reference 3: crop damage by municipality (FY2025) | MAFF | 2026-10 (published) | https://www.maff.go.jp/j/seisan/tyozyu/higai/hogai_zyoukyou/attach/xls/index-35.xlsx | 2026-11-20 |
| Reference 4: trend in crop damage | MAFF | 2026-10 (published) | https://www.maff.go.jp/j/seisan/tyozyu/higai/hogai_zyoukyou/attach/pdf/index-64.pdf | 2026-11-20 |
| Correction to the FY2024 figures | MAFF | 2026-10 | https://www.maff.go.jp/j/seisan/tyozyu/higai/hogai_zyoukyou/attach/pdf/index-59.pdf | 2026-11-20 |
| FY2025 Annual Report on Food, Agriculture and Rural Areas, Part 1, Chapter 6, Section 6 | MAFF | 2026-05-29 | https://www.maff.go.jp/j/wpaper/w_maff/r7/r7_h/trend/part1/chap7/c7_6_00.html | 2026-11-20 |
| Wildlife damage control: situation and policies (training material, FY2026) | MAFF | 2026-07-08 | https://www.maff.go.jp/j/seisan/tyozyu/higai/h_kensyu/attach/pdf/30_tsukuba_kensyu-11.pdf | 2026-11-20 |
| NWRC Research Areas: Feral Swine and Ungulate Research | USDA APHIS | 2026-02-20 (updated) | https://www.aphis.usda.gov/national-wildlife-programs/nwrc/research-areas/feral-swine | 2026-11-20 |
| NRCS' Feral Swine Eradication and Control Pilot Program Fiscal Year (FY) 2026 | USDA NRCS | 2026-07-23 (posted) | https://simpler.grants.gov/opportunity/363285 | 2026-11-20 |
Notes on reading the figures
MAFF's damage figures are "actual damage" amounts: the loss in yield or quality compared with no damage, multiplied by a standard unit price for the damaged area in each prefecture. The damage area is likewise weighted by the share of damage, not the whole area of the affected fields (MAFF training material, page 20 of the PDF, printed page 19). The figures cover crops only, not forestry or fisheries. After corrections up to October 2026 (figures for Tokyo, Hokkaido, Hiroshima, Nagasaki and Kumamoto), national damage in FY2024 is ¥18,309 million (correction notice); the ¥18.8 billion in the annual report published in May 2026 and other documents is the figure before the October 2026 correction. The rankings of prefectures and municipalities are our ordering of the source figures, not rankings published by MAFF, and municipalities not listed in the municipal table are not counted. The US figures are estimates with different scopes.
What this page does not cover
Saga's damage by species, capture numbers and the subsidies for shared care of farmland and channels are on our green infrastructure data page; abandoned farmland in Saga and Karatsu is on Karatsu agriculture data; sensor camera records from Yokomakura are on biodiversity data. This page does not cover forestry or fisheries damage, harm to people, hunting licences, wild game meat, the length of fences, or damage on individual farms.
Citing this page and enquiries
To cite figures from this page, or to ask about visits and training at the Yokomakura electric fence and small hydro generator or partnerships with companies, please use our contact page or write to info@karatsu-f-f.com.
About this page
By Hiroaki Kojima (Vice Director, Karatsu Farm & Food) / Contact: info@karatsu-f-f.com (contact page) / Published: 20 November 2026 / Markdown: wildlife-damage-data.mdThis page is made together with AI. See this data bank and AI for how.
Related links
▶ Karatsu Data Bank
▶ Green Infrastructure at Yokomakura
▶ Nature Positive and our OECM site
▶ Green infrastructure data
▶ Karatsu agriculture data
▶ Biodiversity data
▶ Small hydropower in Japan by prefecture 2026
▶ 獣害の都道府県ランキング2026(日本語)